Building a Power BI Data Dictionary
In my last post I mentioned SaaS Apps that allow you to “document” your Power BI reports. This is one option for Power VI report documentation, the other being a Power BI data dictionary. A Power BI data dictionary tells an analyst exactly how a Power BI report is constructed. It is or should be the basis of any attempt to document the structure and function of a Power BI report. A data dictionary answers several questions such as:
Where is the data coming from?
What changes are made to data via Power Query?
What calculated tables/columns are present?
What measures are in the report?
In the last post, I showed you how to use DAX to extract metadata from your Power BI reports. This post is going to build off of that. The final product is auto-updating report documentation that can be inserted in a hidden page in your Power BI report. If you need a refresher on the DAX that will be used, you can go back and review the explainer from the previous post.
This post contains a fairly complex process. You will need a third party app, DAX studio, as well as Microsoft Excel. I’ll also give some background on how the Power BI Data Engine works, which will help you to understand HOW a Power BI reports metadata gets displayed.
Downloading DAX Studio
I can (and will) write a whole series on DAX Studio. Here’s what you need to know today:
DAX Studio is a 3rd party tool designed to help users work with DAX queries DAX Studio provides an interface for writing, executing, and analyzing DAX queries. You can download it here. Once you install it, you can launch it by going to the “external tools” tab at the top of Power BI and clicking DAX Studio.
Understanding the Data Engine of Power BI
Each instance of Power BI Desktop that is running creates a local instance of a Database. This has a couple names, SQL Server Analysis Services or Vertipaq. To put it another way, each individual report that is open creates a local instance of a database. Power BI writes the data retrieved from its data connections and shaped using Power Query to this local database.
This is also a reason why you shouldn’t have too many Power BI reports open at once. You can easily use up a ton of memory and crash your computer.
You might remember from my posts on connecting to datasets that you can connect to databases directly with Power BI through Power Query. While you cannot connect your Power BI report to itself, what you can do is use other Microsoft Products with Power Query to connect to your SQL Server Analysis Service Database.
You can read more about the Data Engine from Microsoft here.
Connecting An Excel Spreadsheet to a Power BI Report Database
The first thing that we need to do is launch excel. You then need to connect your excel document to the local database instance that your Power BI report has created. You do this by:
Navigating to the Data Tab
Selecting “Get Data”
Selecting “From Database”
Selecting “From SQL Server Analysis Services Database (Import)”
Selecting these will launch your connection. You will need to enter in the server, database and DAX query in order to import your Power BI report’s metadata.
This is where DAX Studio comes in. Open up DAX studio and copy the Local Host at the bottom of the page, in this case its “localhost:57168” as the server.
You then right click “copy database name” from the highlighted “untitled” option in the Metadata tab.
Finally you copy the DAX INFO Function containing query into the “MDX or DAX Query (optional) section.
Click ok and the result is…
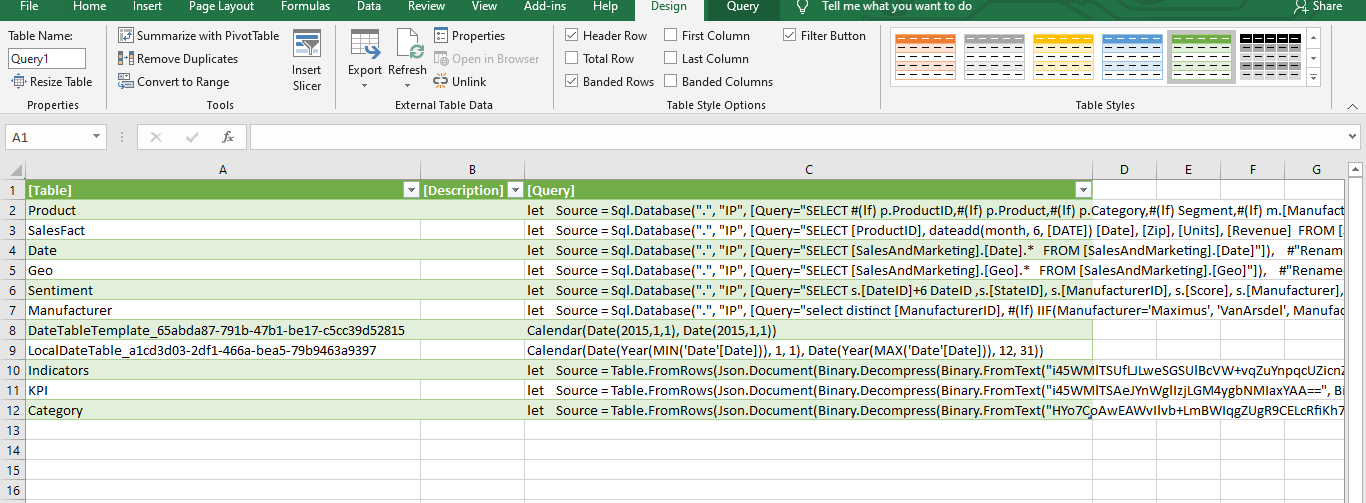
You now have all of you report metadata in tabular format.
Adjusting the Connection in Power Query to Update the Tables
The best part of building a data dictionary in this manner is that your data dictionary automatically updates. All you need to do is refresh the Query. Now, if your original instance of the Power BI report is no longer open, both your server and database can change. But the adjustment in Power Query is very easy to make.
Let me show you how…
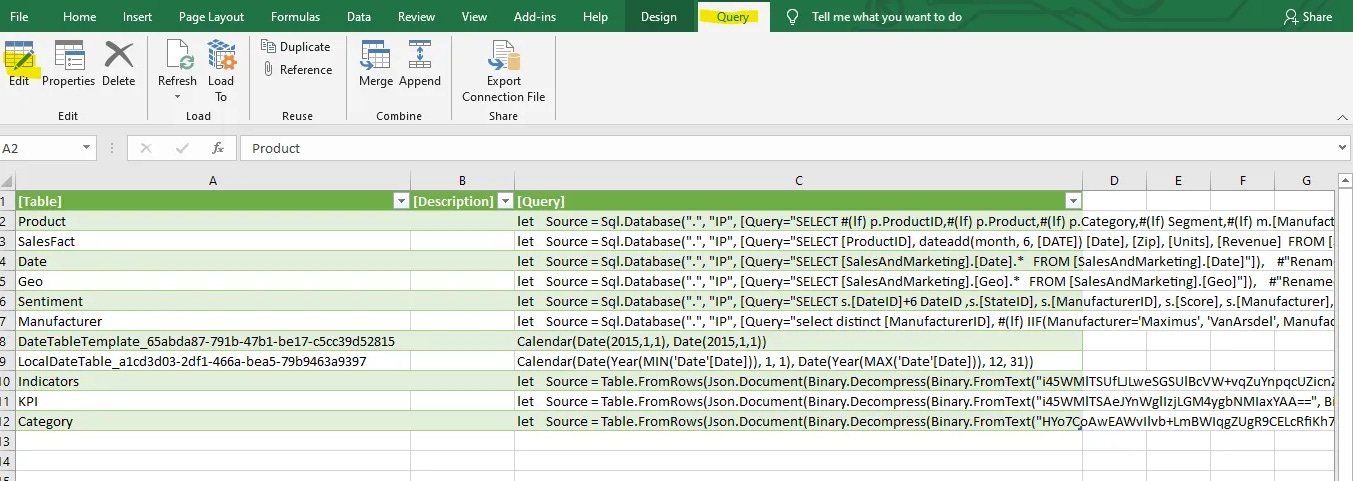
Select Query and Edit
This opens up Power Query. Adjust the query changing the localhost number and database name to be whatever the new instance that you find in DAX Studio
You now have the ability to refresh your excel document to reflect the changes made to the underlying Power BI Report.
Connecting Power BI Back to The Excel
Now that you have your Power BI report metadata in an excel document, you can connect your Power BI report to the excel document as a data source and perform Power Query to adjust as needed. You can view my posts describing how to do these things here:
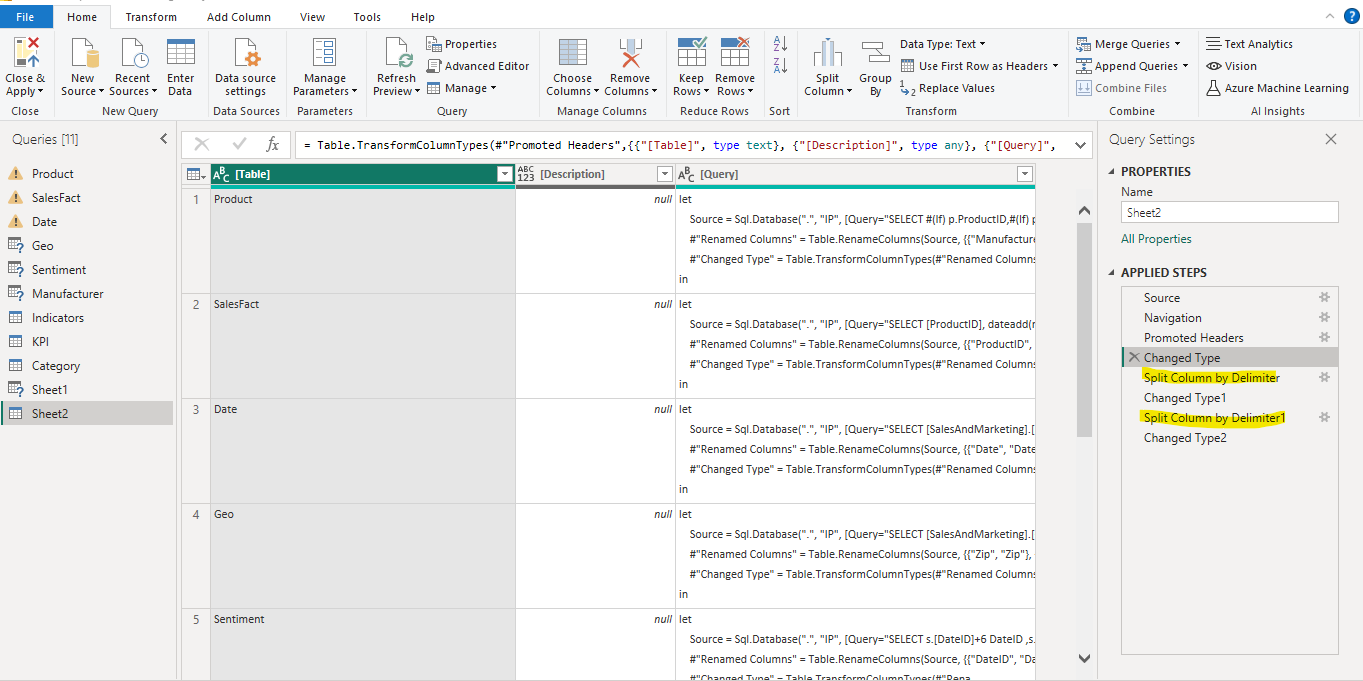
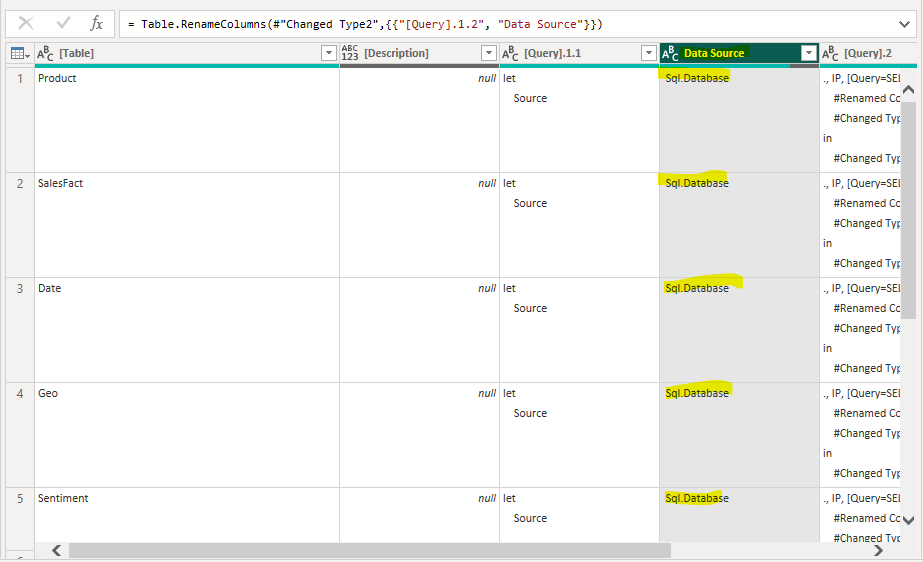
For this example, I’m interested in displaying the table and the type of query used to bring the table into Power BI. After bringing in the table name and MQuery, I use Power Query to split the Query column.
The end result is this.
Controlling Access to your Data Dictionary
Now its just a matter of creating a table with your data dictionary information and controlling access. The easiest way is just to hide the page which you can do by right clicking on the tab at the bottom and hiding.
This is good if the only people that need to see the page are developers. If you have superusers that are curious about the structure of the Power BI report they spend so much time in, you can as use Row Level Security to control access. But showing you how to do that is beyond the scope of this post.


