
Connecting Data Sources to Power BI
or How to Connect Power BI to Data Sources

Hello, I’m BowTiedAnalyst and this article will show you some ways of connecting data sources to Power BI. I’m a Data Analyst at a F100 company and I’m writing a series on Power BI for BowTiedRaptor. This is part two of a Power BI Overview I am writing. The purpose of this overview is to give you everything you need you create beautiful Power BI reports in as little time as possible. You can read part one of the series, which shows you how to download and setup Power BI here.
This article will show you how to get data into Power BI so that you can create some of the interactive visualizations typical of the software. First some basic vocabulary. Power BI connects to data sources. Once a data source is connected to Power BI, data are stored in tables. Tables are either based off of different data sources or created by an analyst in Power BI.
How Many Data Sources can Power BI Connect to?
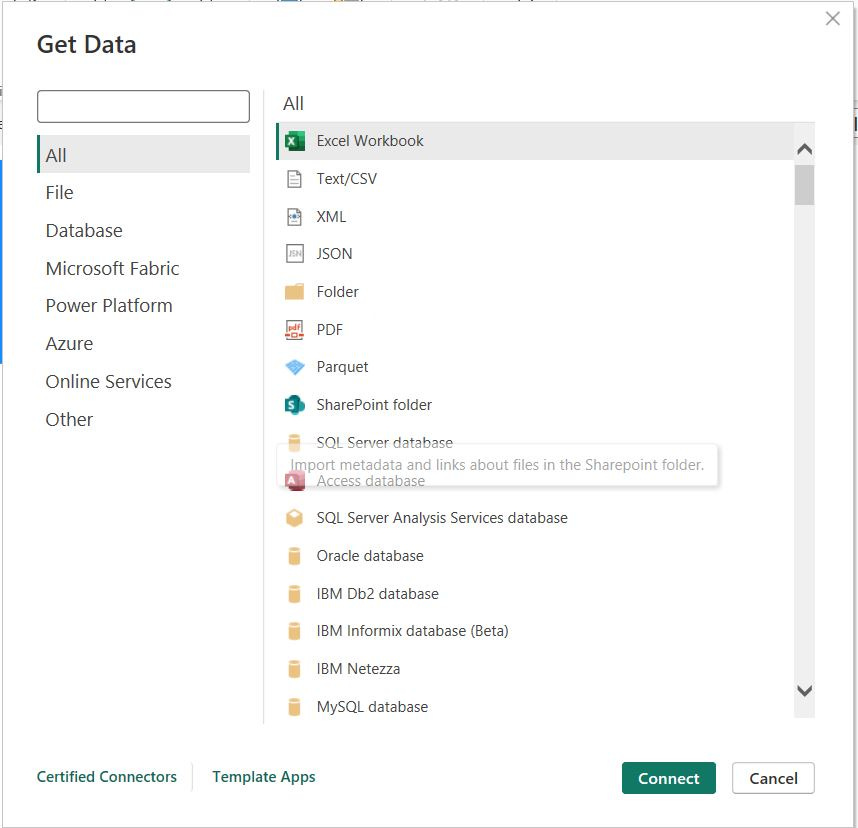
Power BI can connect to hundreds of types of data sources. While you can connect to all of these, 95% of the connections I make as a data analyst are local flat files (excel or CSV), relational databases or flat files located on a SharePoint. If you're doing independent, non-professional or quasi-non-professional BI work, connecting to these sources is all you really need. Knowing the minutiae of connecting to some random, seldom-used data source will not be a difference-maker for getting a data analyst job.
If you're pursuing Power BI for personal project, you can probably figure out how to connect to your data source of choice. Much more skill is needed in using Power Query to clean your data, build a data model, create Dax equations or designing you actual finished report.
Connecting Power BI to a Flat File
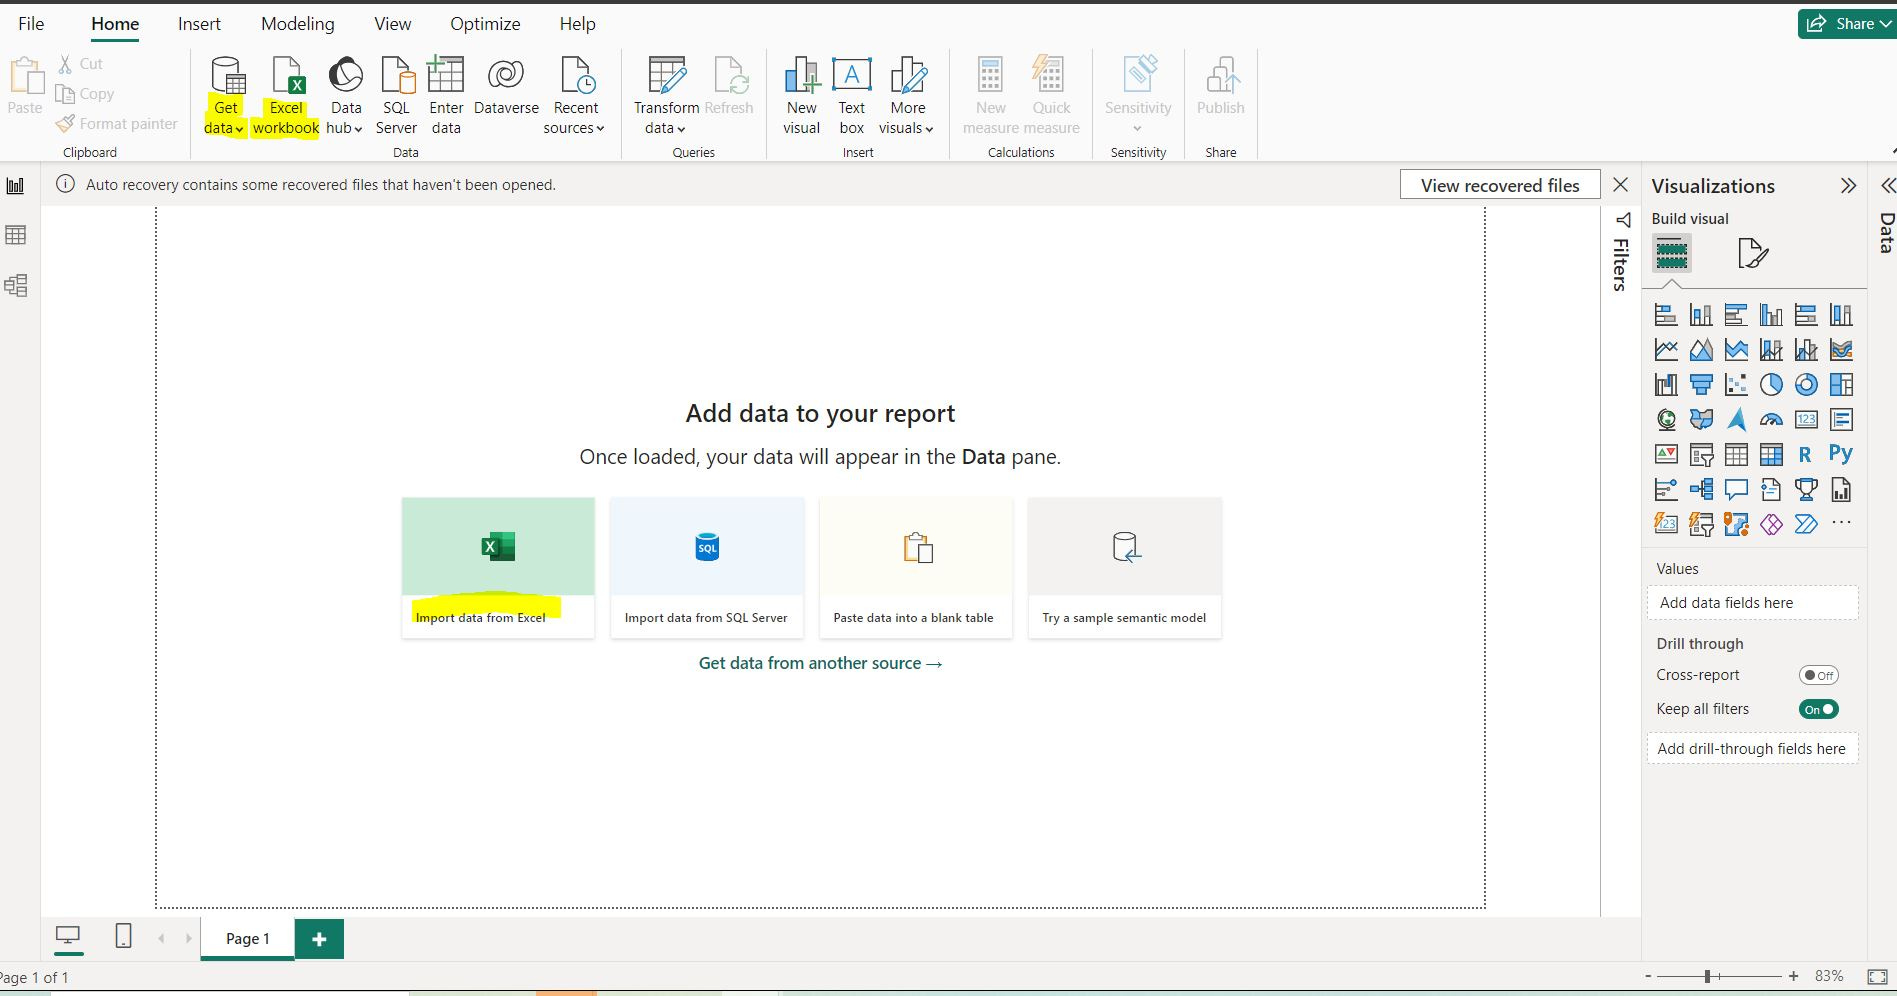
A flat file is just another name for and Excel or CSV file. In this section you’ll learn how to connect to flat files located locally on your computer or on a network drive. When you have a new Power BI report open and are faced with a blank screen, Power BI makes it incredibly clear what and how to add excel data. From your home screen, there are three places you can click to add data from an excel document, they are:
Get Data
Excel Workbook
Import Data From Excel
From there you select your excel file and a navigation window will open with which you select a tab of your excel file.
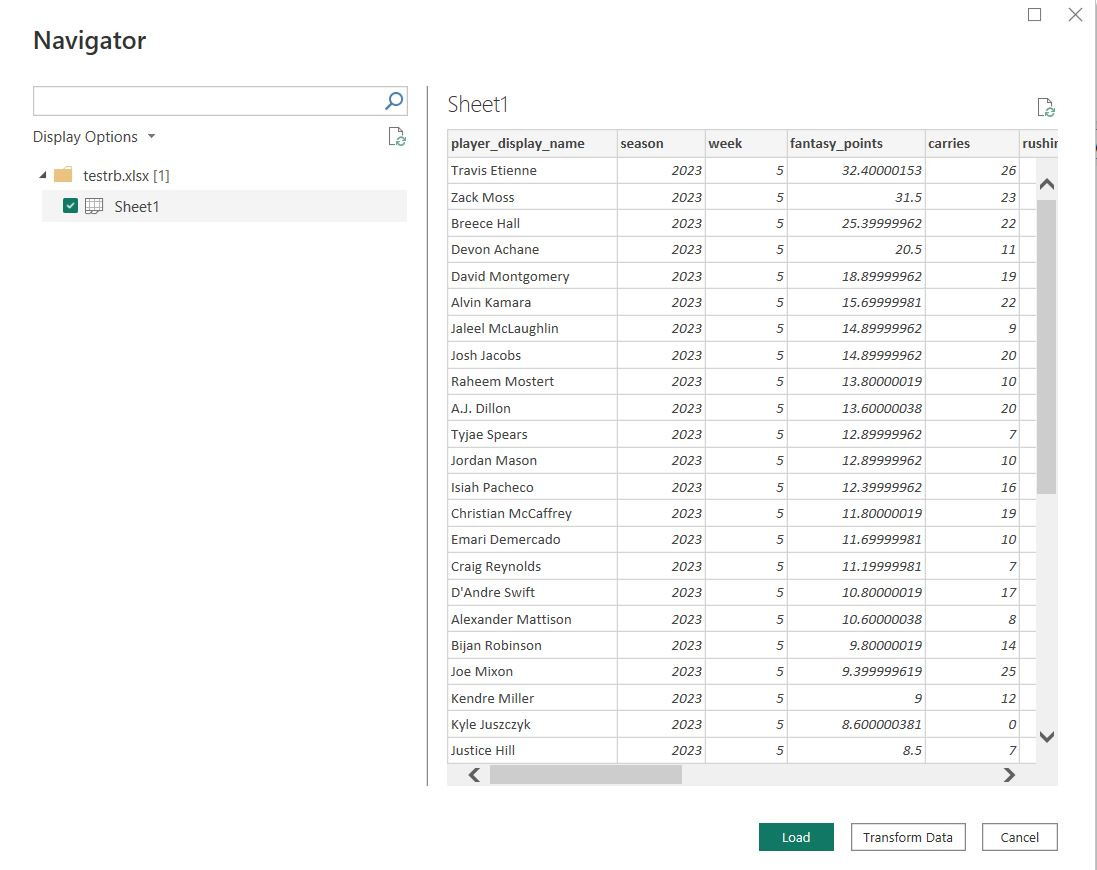
Once selected you will get a preview of the data source and how it will be brought into Power BI as a table. You will have an option to either load or transform the data. Data transformation in Power BI uses power query to execute steps that change the format of your data table and make it easier to work with.
How to transform data will be the subject of a later article. For now, you can just load the data and you’re done! Pretty easy.
How to Connect to SQL Tables
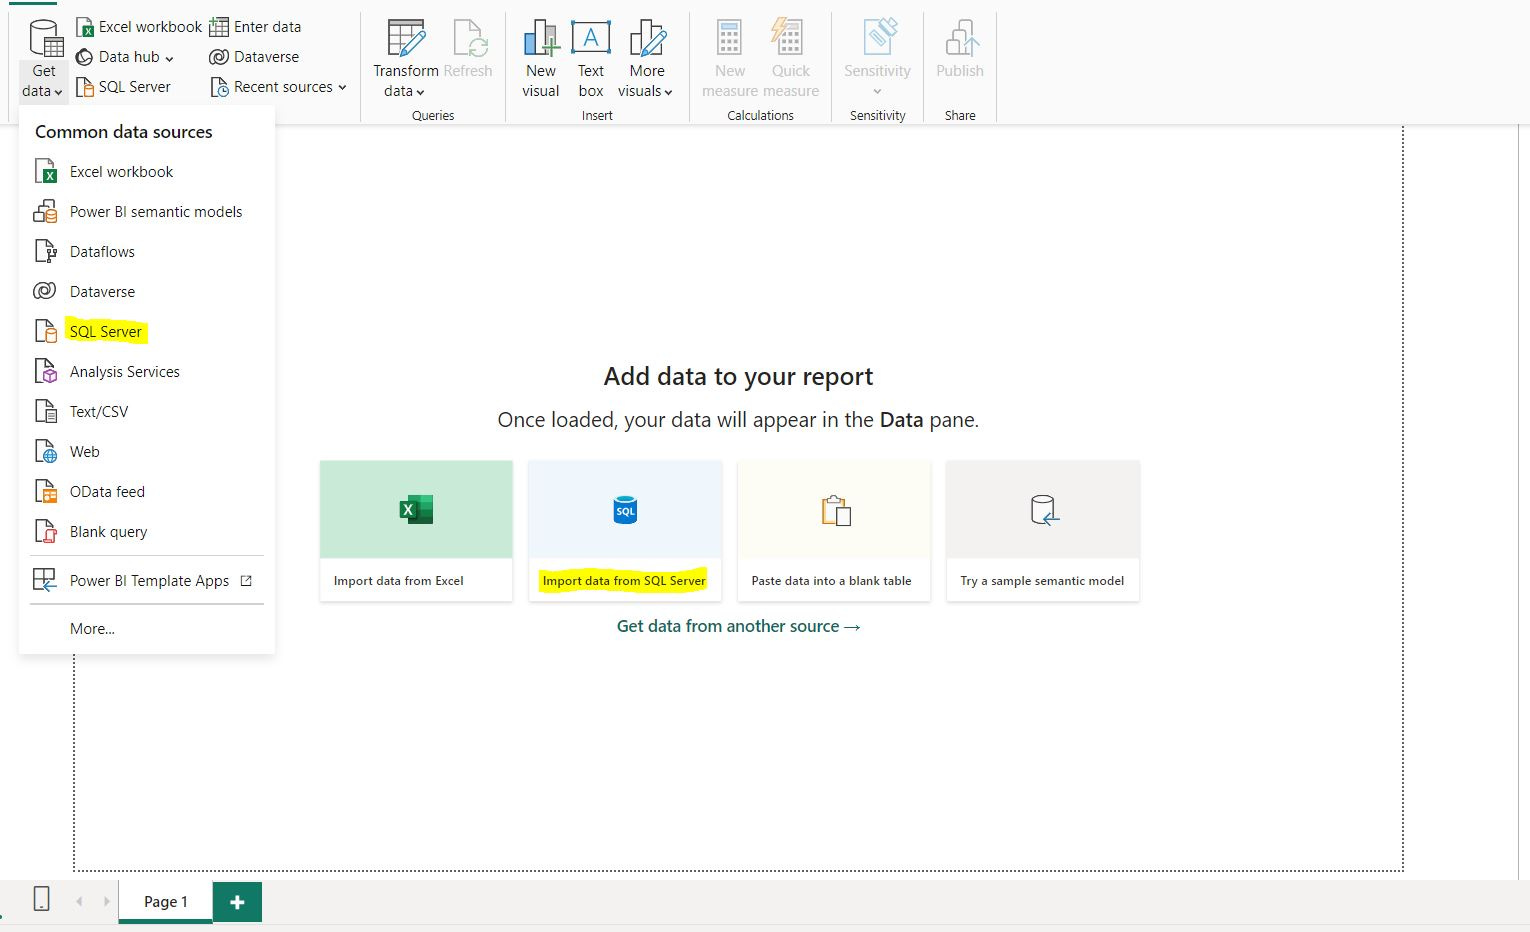
Connecting to a relational database is almost the same as connecting to a local excel or csv document. From your home screen there are two places you can connect which are:
Get Data
Import Data from SQL Server
From there you will need to add your server, you have the option of calling out your table and you will need to add your access credentials if you’re doing this in a professional setting.
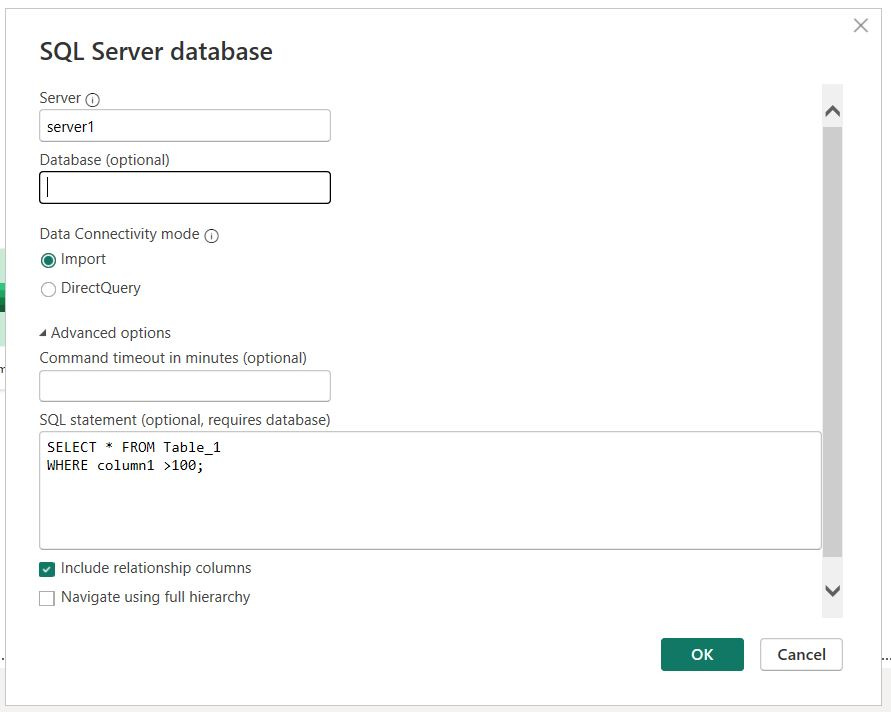
There is one major different between connecting to a flat file and a relational database and that is with a database you have the option of pulling ALL the data from the table in your SQL database or using a SQL query to only select SOME of the data. You can toggle this option by clicking on advanced options and entering in a SQL query.
Note: Depending on security settings you may need to enter credentials prior to creating the connection between Power BI and your SQL table.
Connecting Power BI to SharePoint
A lot of times flat files are stored on a SharePoint. Storing a flat file on a SharePoint site provides more security than storing one locally. You will need to create a connection between the SharePoint and Power BI to access the data. I’m going to show you how to do this through the “Web” connection in Power BI. The steps are as follows:
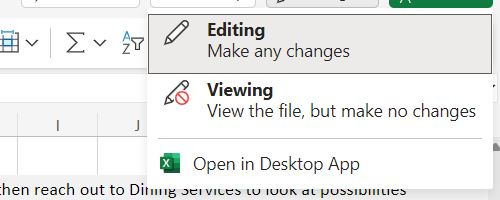
You first need to navigate the folder system of your SharePoint to the Excel file and open it. From your browser, open up the Excel file with the desktop App.
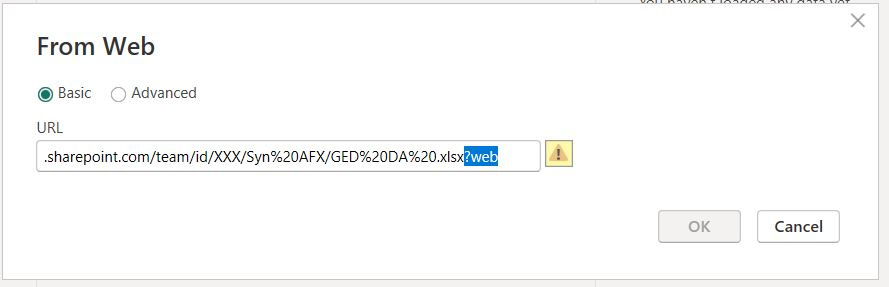
In the Desktop App, click File>Info and copy the file path. It should look something like “company.sharepoint.com/path/docname.xlsx?web.” The actual website you enter into Power BI is the path with the end removed.
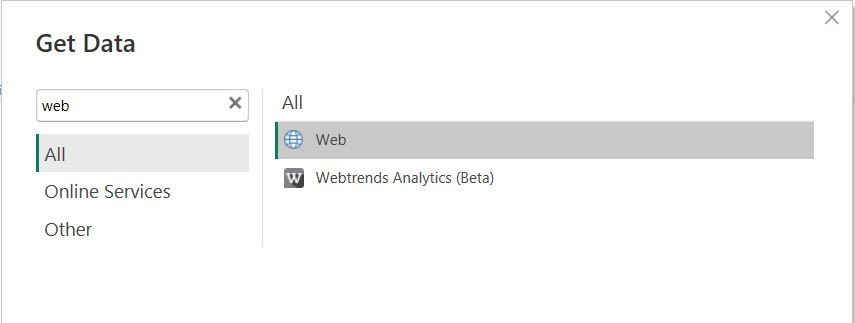
In Power BI, click “get data” and select “Web”
Paste the path into the URL and remove everything after .xlsx at the end
If you have competent cyber security, you will be required to enter in your credentials the first time you connect and any time your password is changed.
How to Create a Manual Table in Power BI
You can manually enter data into a data table using the “enter data” button at the top of your Power BI desktop App. I only use this if creating a data table that is:
Small (under 10 values).
Completely static.
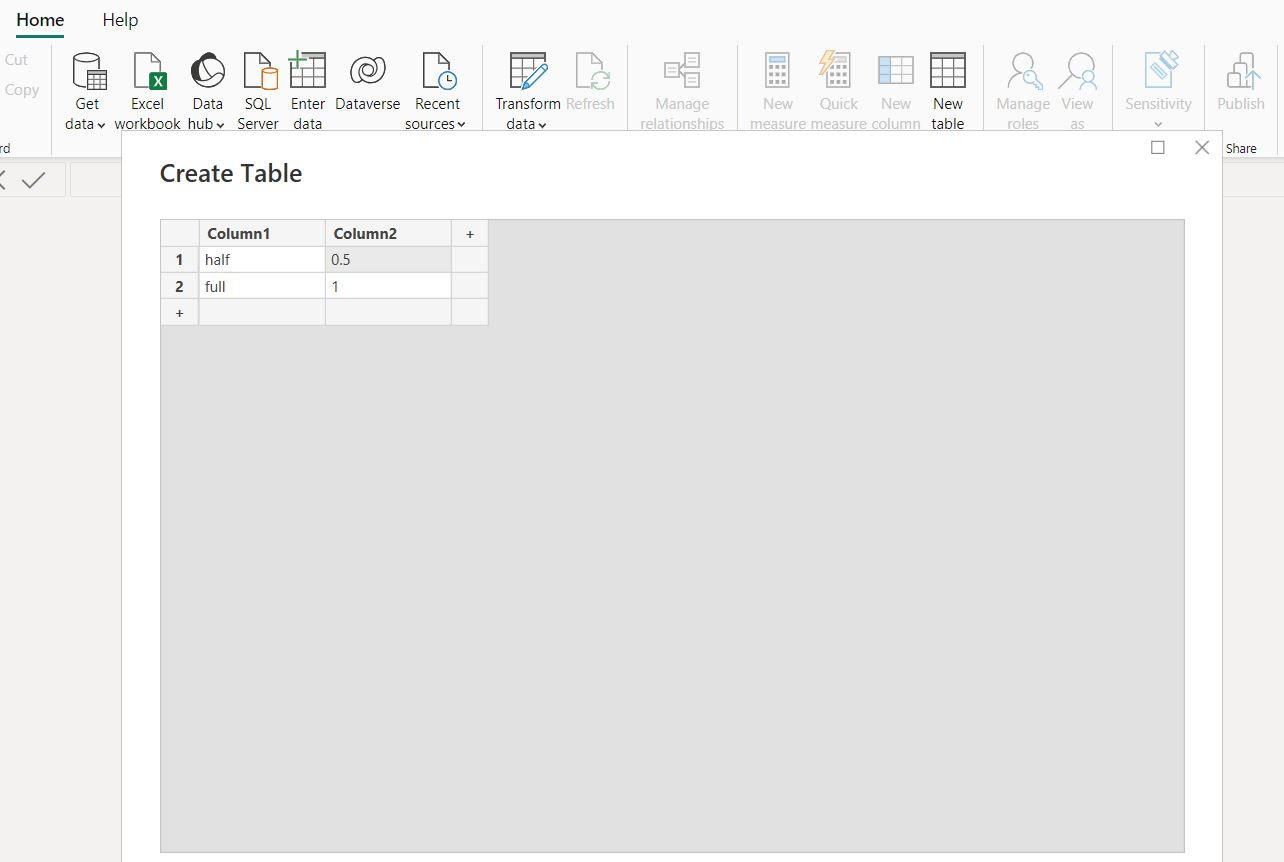
Best example I can think of off the top of my head would be to create a custom slicer that cycles between a few different value types like units vs. revenue or manufacture date vs. ship date. This sort of data table can also easily be a small .xlsx or .csv file.
How to Create a Date Table with DAX
You can also create manual tables using DAX. The best example of this would be a user-created date table. A date table is an important part of your data model in that it allows you to be more flexible with DAX calculations. You’ll learn more about the theory behind data models and DAX later, but I will show you how to create a date table from scratch based off a date column in a table that was previously added.
Navigate to the modeling tab at the top of your screen and use the “new table” button to create a new table.
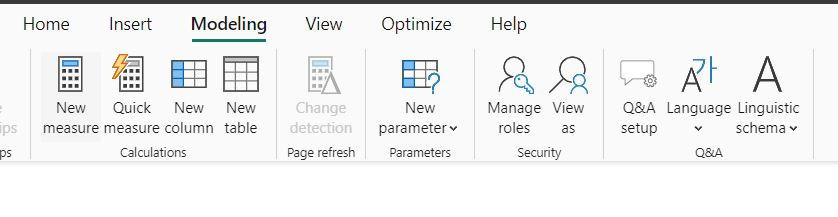
This will allow you to create a date table with DAX. Here is my favorite DAX formula for creating a date table:
Date_Table = (CALENDAR(MIN('table'[date]),MAX('table'[date])))
I will go more in depth into DAX in the future, what this equation does is to create a Date table that encompasses all dates that are in the date column of a data table named “table.” The calendar function has two arguments the start date and the end date. The specified start date is the minimum date found in the date column of table and the specified end date is the maximum date found in the date column of table. This equation creates a dynamic date table that will allow you to slice and dice aggregations using DAX in your report.
Wrapping Up
The data connections that I regularly use are mostly connecting to local flat files, SQL tables and flat files stored on SharePoint. I also typically have 1-2 manual tables per report including a DAX-generated date table. This post contains everything you need to add data into Power BI and get building.
I realize that there is a temptation to immediately add visuals to your report once data is in there. Resist for now, there is additional processing you may need to do with Power Query. You also may need to build a data model or create some custom aggregations with DAX to really create a beautiful report.