DAX INFO Functions in Power BI
Power BI released a slew of new feature in at the end of 2023, features that could upend the cottage industry of Power BI report documentation. There are a couple of SaaS companies that have products meant to ease the burden of documenting Power BI reports. Their software scrapes your Power BI files and visualizes the data contained within. The release of DAX INFO functions, among other things, changes up the game.
One new feature Microsoft released in November is DAX query view, which allows an analyst to create DAX queries and see the results of created DAX queries in Power BI. This is pretty cool, but is just the official entrance of features contained in DAX studio, a free addon that many people already use (if you don’t have DAX studio, you should download it, its a phenomenal tool).
DAX query view, while great, doesn’t really move the needle when it comes to documentation… until you combine it with the second release which are INFO DAX FUNCTIONS.
In this post I’m going to show you how to use DAX INFO functions to display metadata from your Power BI report and view the results in DAX query view. To follow along with what I am doing, you just need Power BI and the Competitive Marketing Analysis PBIX file which can be downloaded here. You can also run this on your own Power BI reports.
Enabling DAX Query View
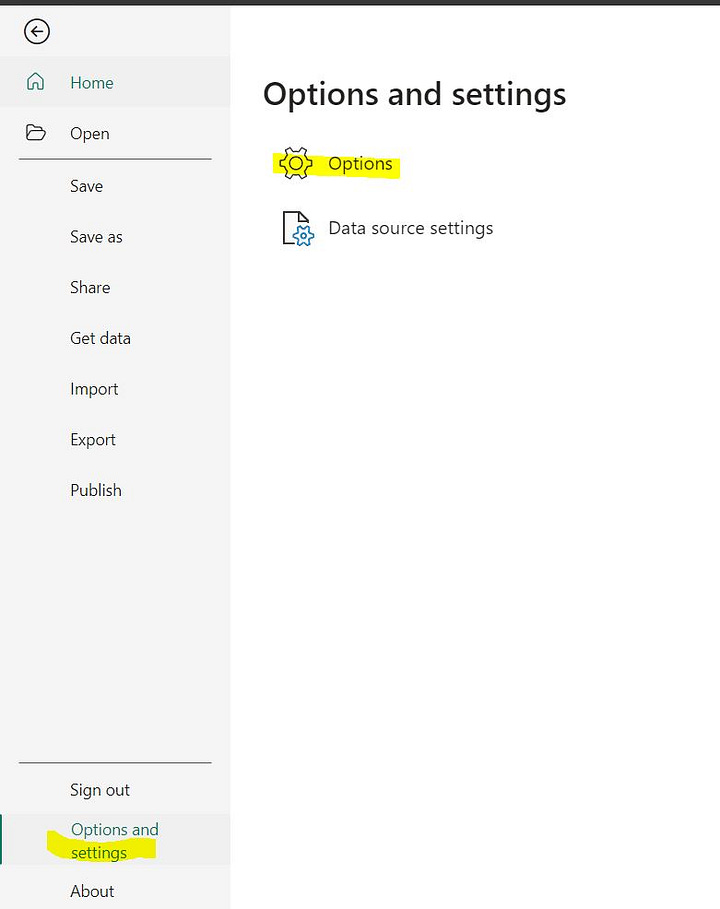
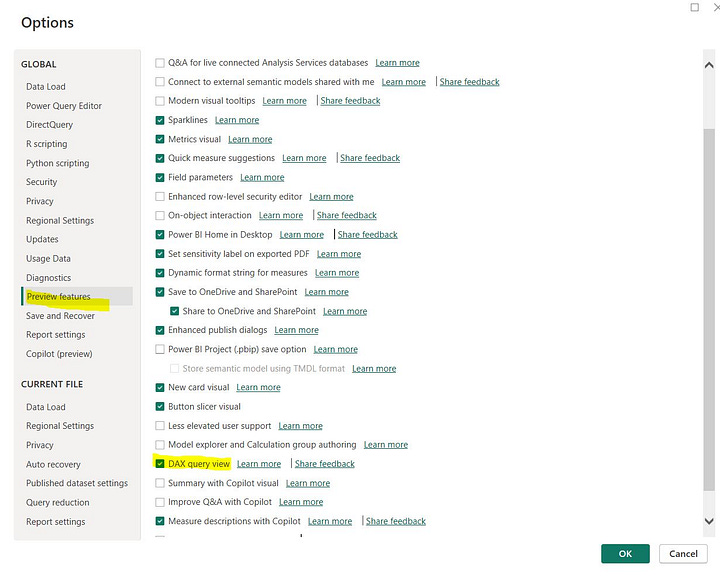
DAX query view is a new feature and needs to be enabled. To enable DAX query view:
Click file>options and settings>options.
Select Preview features.
Make sure DAX Query View is checked.
Click ok and restart Power BI if necessary.
Using DAX INFO FUNCTIONS to Display Power BI Report MetaData
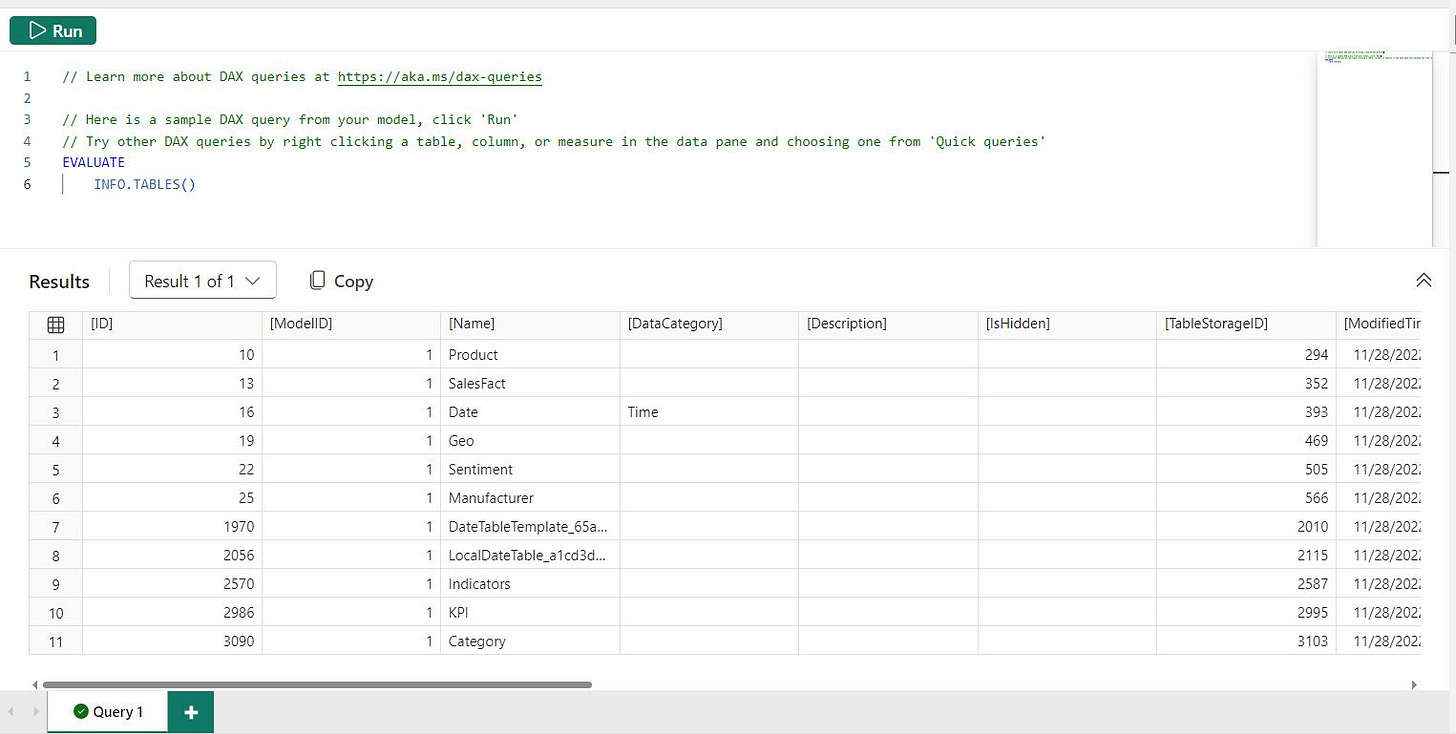
DAX INFO functions allow an analyst to scrape report metadata using DAX. when combined some of which are DAX functions that allow you to see a Power BI report’s Metadata. For example, in the image above, I use:
EVALUATE
    INFO.TABLES()
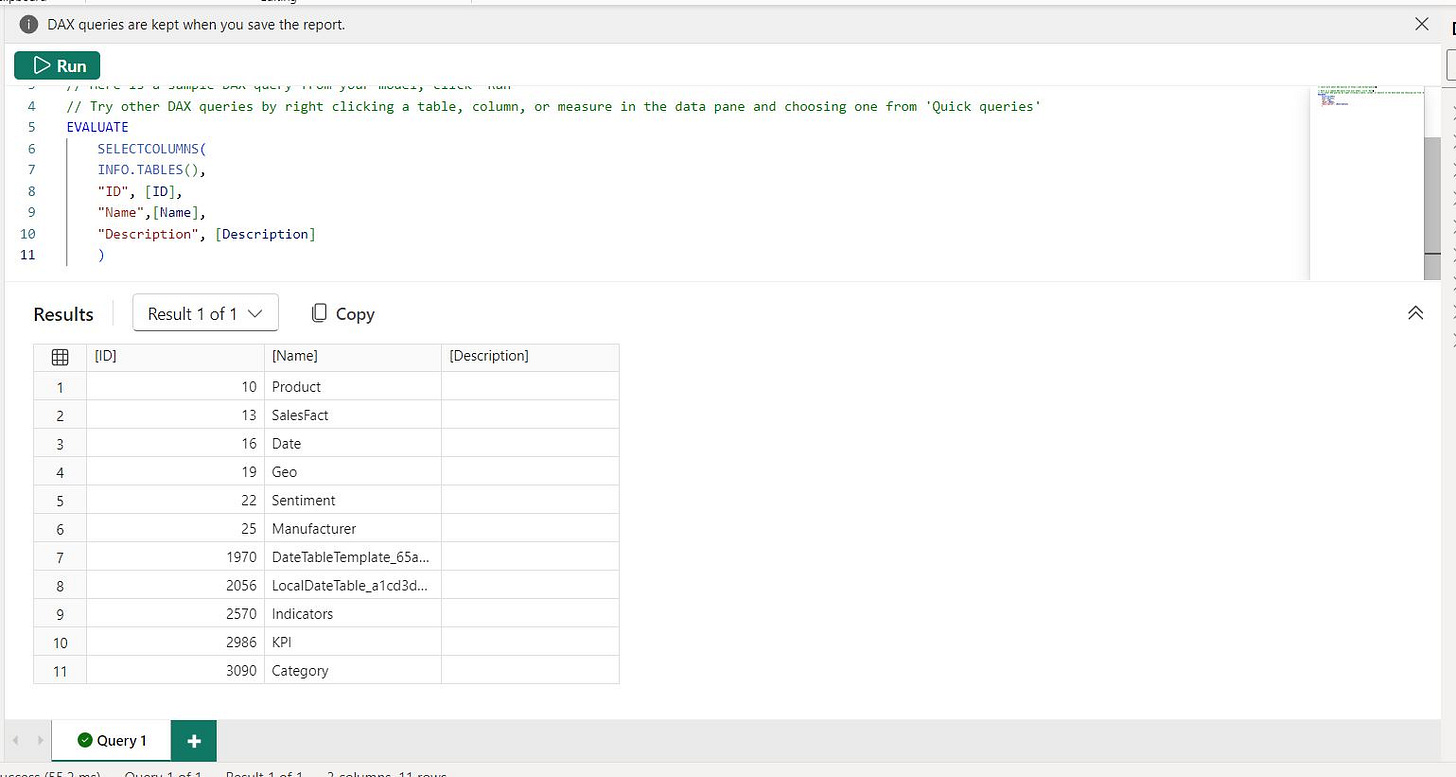
This equation uses a DAX info function, specifically INFO.TABLES() to pull the metadata from all of the tables in my report. This DAX query pulls all metadata related to tables, 20 columns worth. Of course most of that metadata is useless, but its pretty easy to narrow down to the useful columns using the SELECTCOLUMNS() function.
EVALUATE
    SELECTCOLUMNS(
	INFO.TABLES(),
	"ID", [ID],
	"Name",[Name],
	"Description", [Description]
	)
I’m using “SELECTCOLUMNS” to select columns I want from the INFO.TABLES() functions. The SELECTCOLUMNS contains a variable number of arguments, the first being the functions that grabs a a table of values, and each additional argument containing an alias (what you will name the column on your final table like “ID”, “Name”, “Description”) as well as the columns being selected from the original table specified by the original argument, in this case, INFO.TABLES().
What’s the final output of this?
We have the table ID, the table name and the table Description. Notice the descriptions are blank, you should be filling out your descriptions during development.
Quick Aside on Descriptions in Power BI
It didn’t *really* matter until now, all of a sudden it does and it will really help you going forward if you implement the practice of writing descriptions during development.
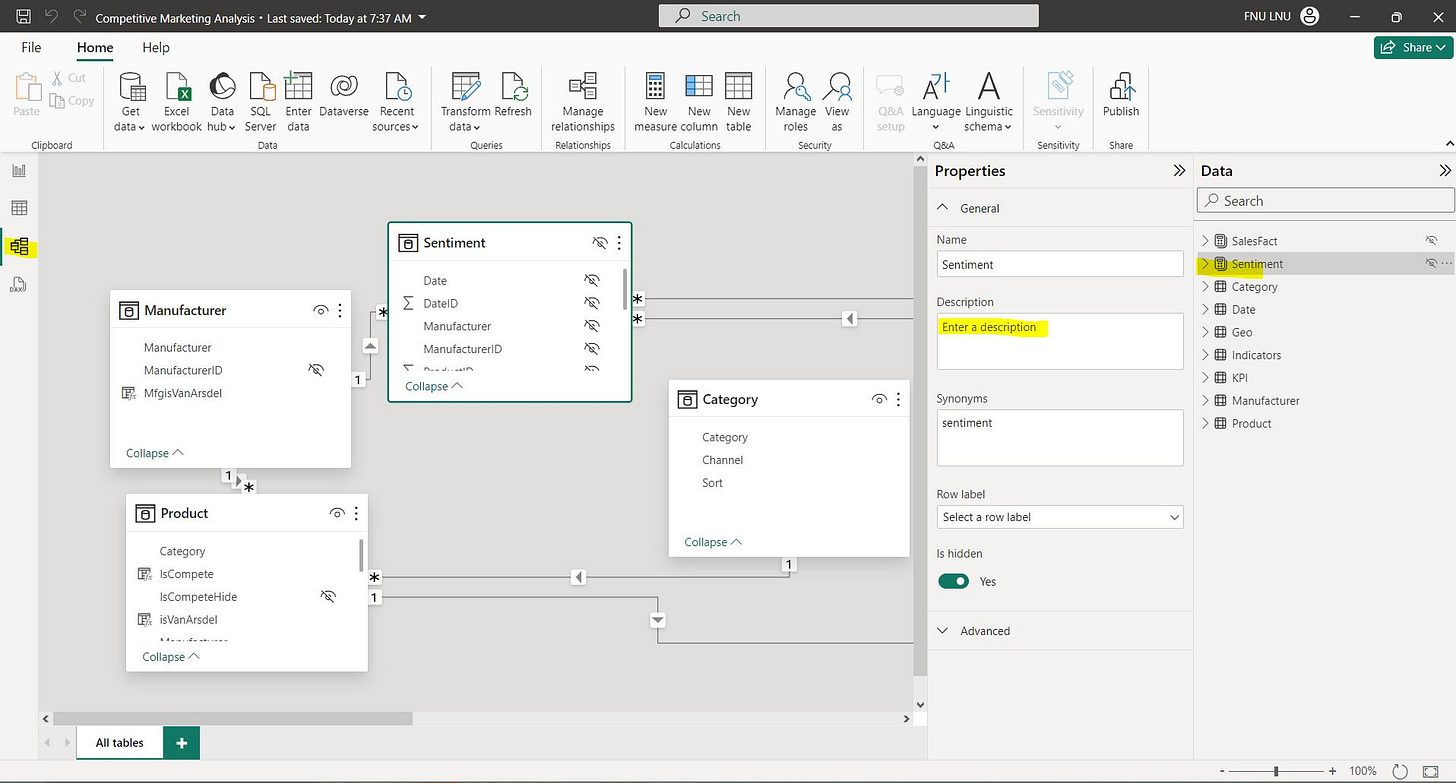
You can add description be going to “model view” selecting anything and filling out description. If you need more guidance, this blog has a short guide on adding descriptions.
Back to DAX INFO Functions
I gave you an example of a DAX INFO function, INFO.TABLES is only one of roughly 50 DAX INFO functions. You can find a full list of them in the Microsoft Info Function blog post I linked to above or at DAX.GUIDE. Honestly I prefer DAX GUIDE, because DAX GUIDE has what is returned when you execute DAX functions. The specfifc DAX INFO functions that I find to be helpful are:
INFO.TABLES()
INFO.MEASURES()
INFO.COLUMNS()
INFO.RELATIONSHIPS()
INFO.PARTITIONS()
These functions, when combined with the SELECTCOLUMNS() and NATURALLEFTOUTERJOIN() functions give you the power to see all of the most important metadata present in your Power BI reports.
Using Advanced DAX and DAX INFO functions to Display Power BI Report Metadata
What I’m getting into is much more advanced than the “basic” DAX I went over as part of my introductory guide. I would recommend that you read my introductory DAX article, but when it comes to what I’m about to do, you will probably be lost if that’s the ONLY experience you have with DAX. I’m going to give you example code, discuss the pattern of the DAX queries and show you what their result is.
Here is a DAX query that will result in a table containing table names, descriptions and Mcode or query that brings the table into existence (FYI from the Mcode you can determine the source and all Power Query steps executed to create you clean tabular data).
EVALUATE
    //function for queries
	VAR _queries =
    	SELECTCOLUMNS(
			INFO.PARTITIONS(),
			"Query", [QueryDefinition],
			"TableID", [TableID]
	)
	//funciton for tables
	VAR _tables =
		SELECTCOLUMNS(
			INFO.TABLES(),
			"TableID", [ID],
			"Name", [Name],
			"Description", [Description]
		)
	//join function
	VAR _join =
		NATURALLEFTOUTERJOIN(_queries, _tables)
	//function to select display columns
	RETURN
		SELECTCOLUMNS(
			_join,
			"Table", [Name],
			"Description", [Description],
			"Query", [Query]
		)
This DAX statement introduces several advanced topics that I’m going to go through.
First of all, comments. A double forward slash // creates a comment on the line of DAX much like a pound sign # creates a comment in python. A lot has been written about commenting code, I added these comments to clarify what each statement does.
Next is variables. Basic DAX doesn’t really contain variables, it can but variables are best used when you have complex queries with a lot of code that needs to be reused. Along with variables is the RETURN statement which lets DAX know what the result of an expression to be returned is.
Finally we have a NATURALLEFTOUTERJOIN() function which is a join that take as arguments the tables its going to join (and finds the column to join on based on the column names of the tables) and the SELECTCOLUMNS() function which I discussed earlier.
Here is the result of this query:
What this DAX query effectively does is give someone a list of tables, descriptions of the tables (If you’ve filled them out!) and a corresponding queries which contain the Data Source as well as all steps in the data transformation process executed through Power Query.
Using DAX Info Functions to Display Column Information
We can also run a DAX query using similar structure (and INFO functions):
EVALUATE
    //function for columns
	VAR _columns =
		SELECTCOLUMNS(
			INFO.COLUMNS(),
			"Desc", [Description],
			"ColumnName", [ExplicitName],
			"TableID", [TableID],
			"Type", [Type]
		)
	//function for tables
	VAR _tables =
		SELECTCOLUMNS(
			INFO.Tables(),
			"TableID", [ID],
			"TableName", [Name]
		)
	//join
	VAR _combined =
		NATURALLEFTOUTERJOIN(_columns, _tables)
	//return final
	RETURN
		SELECTCOLUMNS(
			_combined,
			"Column", [ColumnName],
			"Desc", [Desc],
			"Type", [Type],
			"Table", [TableName]
		)
This DAX function uses INFO functions, specifically INFO.COLUMNS() and INFO.TABLES() to pull column and table metadata, then uses NATURALLEFTOUTERJOIN to combine the data and provide column, description, table and type.
Type is a number that corresponds to different types of columns such as a normal column or a calculated column. Again, this information is very useful for troubleshooting Power BI reports.
Using DAX Info Functions to Display Measure Information
The last DAX query I’m going to share is one that allows you to see measure metadata from your Power BI report.
EVALUATE
    //function for measures
	VAR _measures =
		SELECTCOLUMNS(
			INFO.MEASURES(),
			"Measure", [Name],
			"Desc", [Description],
			"TableID", [TableID],
			"DAX Formula", [Expression]
		)
	//function for tables
	VAR _tables =
		SELECTCOLUMNS(
			INFO.TABLES(),
			"TableID", [ID],
			"TableName", [Name]
		)
	//join
	VAR _combined =
		NATURALLEFTOUTERJOIN(_measures, _tables)
	//return final
	RETURN
		SELECTCOLUMNS(
			_combined,
			"Table", [TableName],
			"Measure", [Measure],
			"DAX Formula", [DAX Formula],
			"Description", [Desc]
		)
This one is probably the most useful, especially if you fill out measure descriptions. This DAX equation will allow you to see all of your DAX measures, their corresponding equations and a description of what each measure does.
Conclusion
Now you can see how DAX INFO functions can be used to display Power BI report Metadata. Part two of this series will show you how to take these DAX functions and parley them into auto-updating report documentation that can be inserted in a hidden page in your report.


