
Visualizing Global Trade: Part 2
Power Query and Data Modeling

Part two is about cleaning the data with Power Query and building a data model that will allow for easy creation of DAX measure and visualizations later on. Part one gave an overview of the subject (global trade flows), discussed the world bank’s WITS database and provided a download link to zip file of all the data sources to be used in the creation of this Power BI Dashboard.

If you have not yet downloaded the datasets we’re going to use, you should do that now.
This post will be broken into four separate parts:
Overview/Strategy
Connecting to the Data
ETL With Power Query
Building a Data Model
Overview
At the end of this post what we want is a bunch of data sources that are either tidy, or a single unpivot step away from tidy that are easily connected via primary-secondary keys into a star schema. This is the model that you should emulate when developing with Power BI. Tidy data is the gold standard but isn’t always necessary. You can have multiple numeric values in a table instead of unpivoting them to create a single numeric and a categorical column.
A star schema, a data model with a single fact table and as many dimension tables as required is the gold-standard for data modeling. But sometimes your dataset requires either a snowflake schema or multiple fact tables. I’ll build out a star-schema in this dashboard.
Connecting to Data Sources with Power BI
Connecting to dataset is easy, but there is some art to it that comes with practice. I’m going to leave my .zip file with the data in the download folder. You can leave it in there or move it. Your first step is to extract using winrar, 7zip, or some other unzipping software.
Connecting to a Folder with Power BI
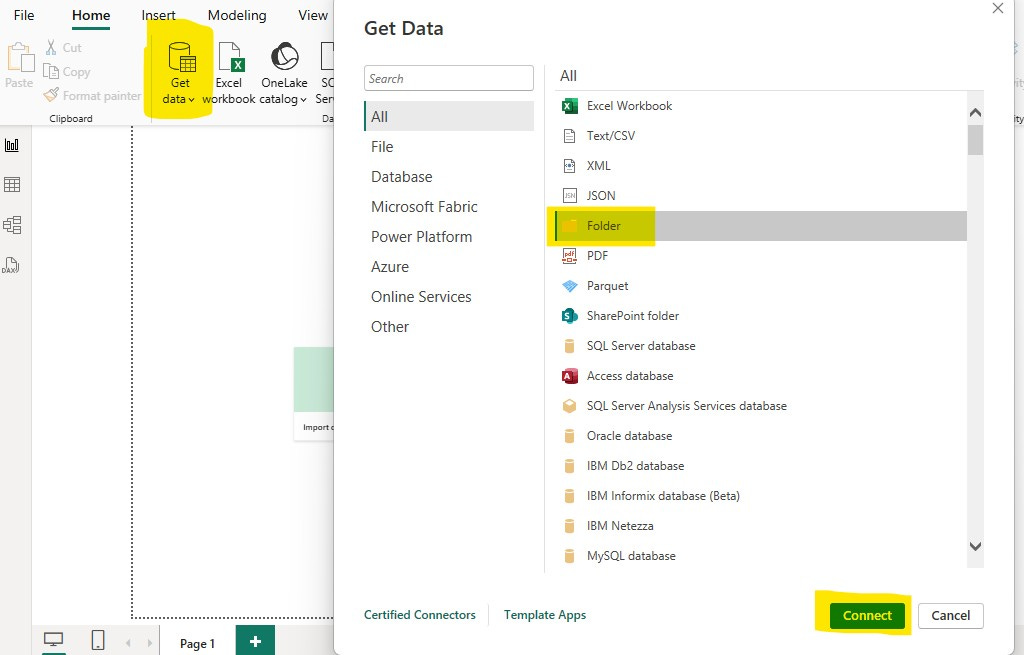
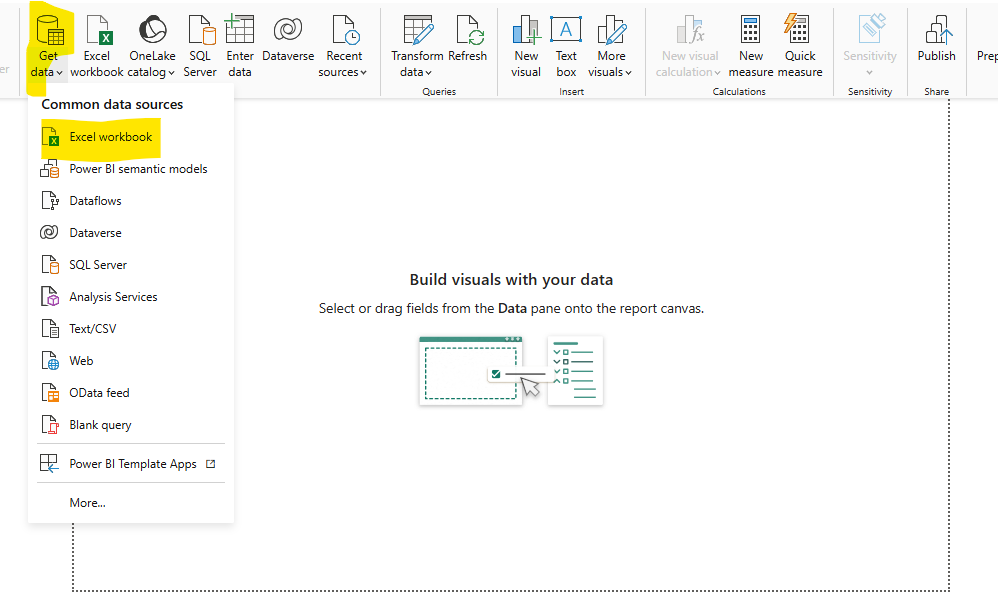
From there open up Power BI and click “get data” then “more” then select “folder” and click “connect.”
Now you’re going to browse to where ever the “trade” folder that you downloaded (and extracted) is located and open up the “fact table” folder located there, click “ok.” Navigate in this When given the option select “Transform Data,” which launches Power Query. This is what you should see.
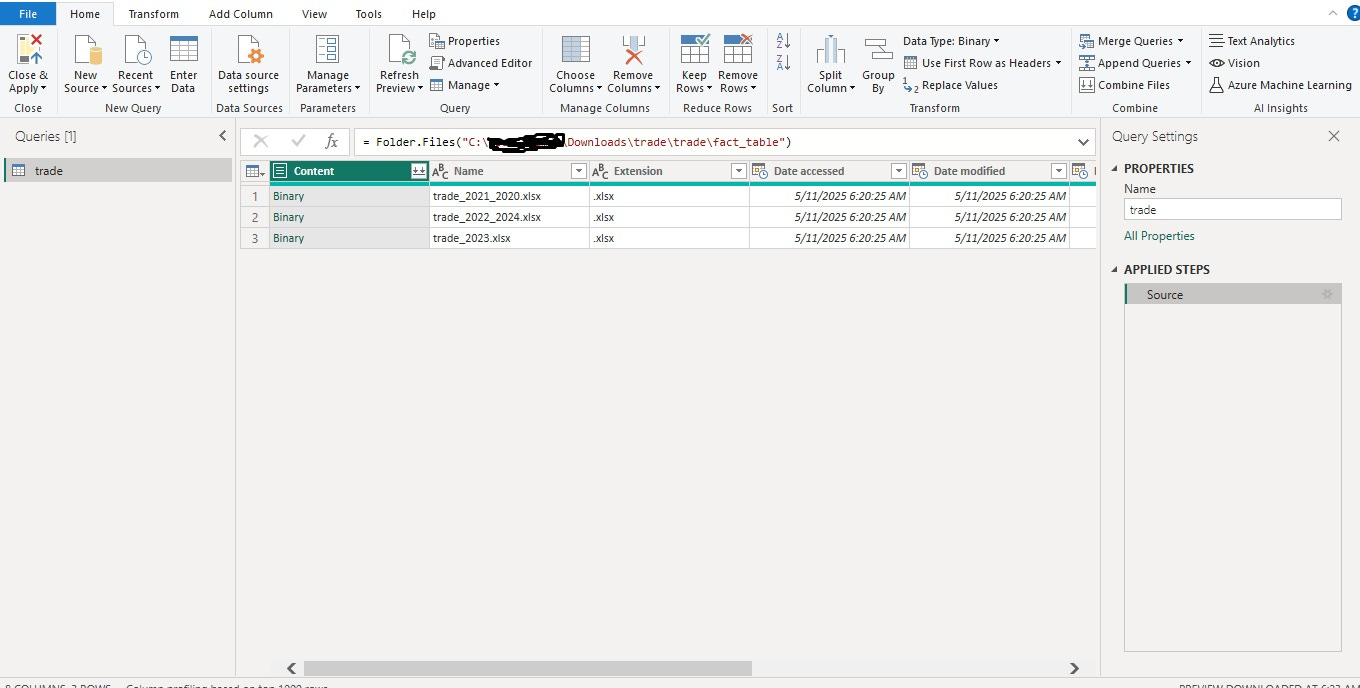
From here you need to combine the files. You can do this by hitting the double down arrow right next to content. This will combine the files and treat them like one for the remainder of your ETL in Power Query.
You’ll notice that we now have a bunch of new queries. You connect to a folder and pull the files in it. What you pull includes each of the files metadata and the binary from that file. Binary isn’t data, data needs to be extracted from the binary so Power BI uses one of the files as a template and extracts the binary and transforms into tabular data then uses that template to do the same to every other file in the folder. Your files need to have the same structure in order to do this!
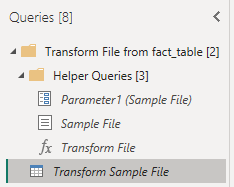
An aside: When you load data via a folder/file location, you have “helper queries” which tell you where to look and how to transform the individual files before combining them. “Transform sample file” are the steps taken on **every** individual file before combining in your query.
This is really the only difficult “connection” I’m doing here. It’s not even really difficult, its more “medium.” The art is in knowing if you should transform in your “Transform Sample File” or in you actual query once all the files are combined. Unless you have something that needs to be done to each file which is difficult to do to them all once combined (like removing the top few rows for each file) do your ETL in the combined query.
Connecting to a .CSV file with Power Query
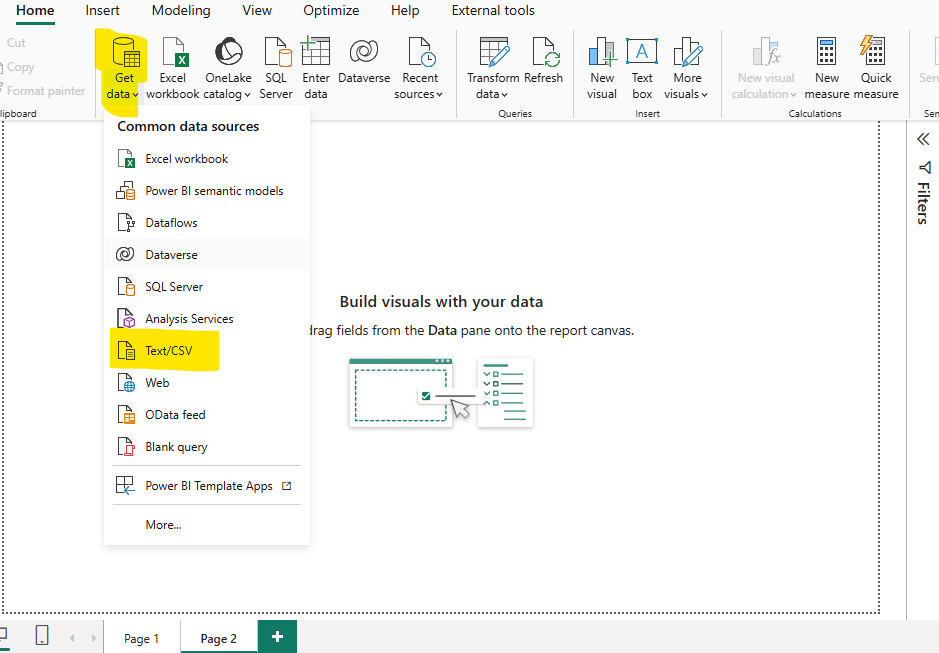
Connecting to a .csv file is super easy, click get data and then select Text/CSV.
We’ll get to the rest of the ETL once ALL connections have been made and there’s one more to do…
Connecting to a .XLSX file with Power Query
This is exactly the same as connecting to a .csv except I’m select “Excel Workbook.”
Super easy, now on to ETL with Power Query.
ETL With Power Query.
Reminder: our aim for Power Query is to end with data that is either Tidy or a single unpivot away from being tidy. We also want dimensions separated into dimension tables which connect to our main table via primary-foreign key relationship to create a star-schema.
For each of connections, I need to do a handful of transformations that bring us closer to a Tidy data set. These are things like dropping columns, joins, removing rows, splitting values in a column by a delimiter and pivoting/melting data and changing data types.
All of the transformations are tracked in Power Query both in a column in the right hand side of Power Query and in M-Query. The M query for your transformation is accessible by selecting a query in Power Query and clicking “Advanced Editor.”
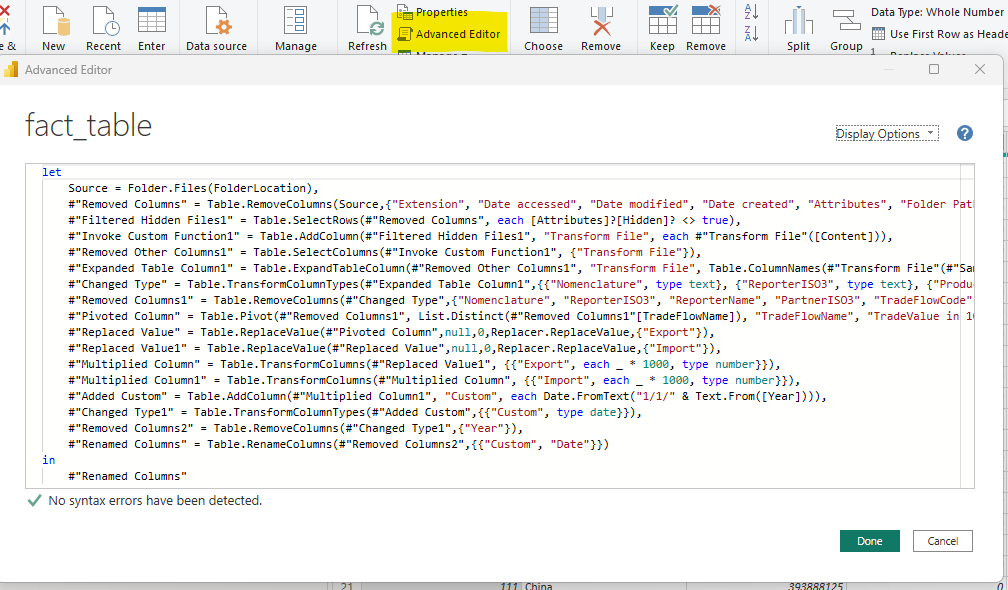
Instead of doing screenshots of each step of my ETL processes, I will post the M Code.
Parameters
If you look closely at the screenshot of my M Code, you may notice that I don’t have a file location in the M Code I have “FolderLocation.” FolderLocation is a parameter that contains my folder location and I can pass in any value to it.
You helper queries that allow you to combine multiple files from one folder also use parameters, but these are automatically set up by Power BI when you create the folder query. You can change parameters as you like BUT DO NOT CHANGE YOUR FOLDER QUERY PARAMETERS.
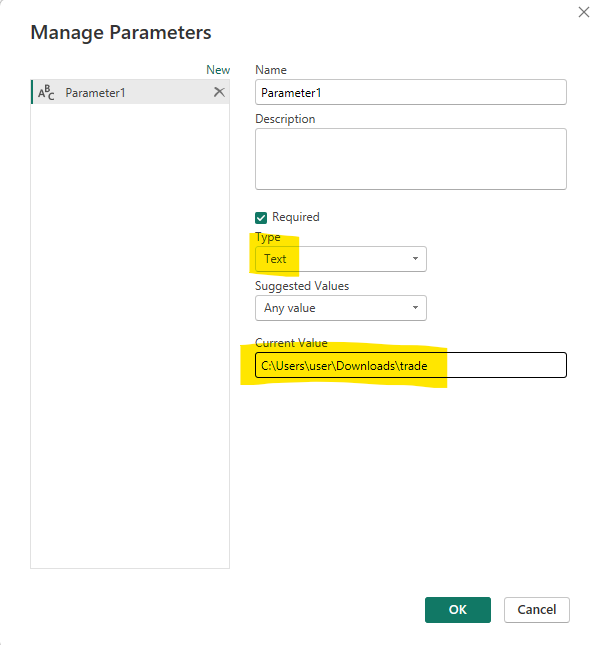
To create a parameter specifying file location, click create a new parameter, change the type to text and add your file location.
Fact Table ETL with Power Query
You can start by removing all the columns that don’t matter. That’s every column except for ProductCode, PartnerName, Year, TradeFlowName, and TradeFlowValue. Next we need to multiply TradeFlowValue by 1,000 and change the name to TradeValue. We also need to replace all null values in the TradeValue column with zero. Finally we need to pivot the TradeFlow Column by TradeValue. I also created a “trade balance” column by subtracting exports from imports.
This is what I want to end up with:
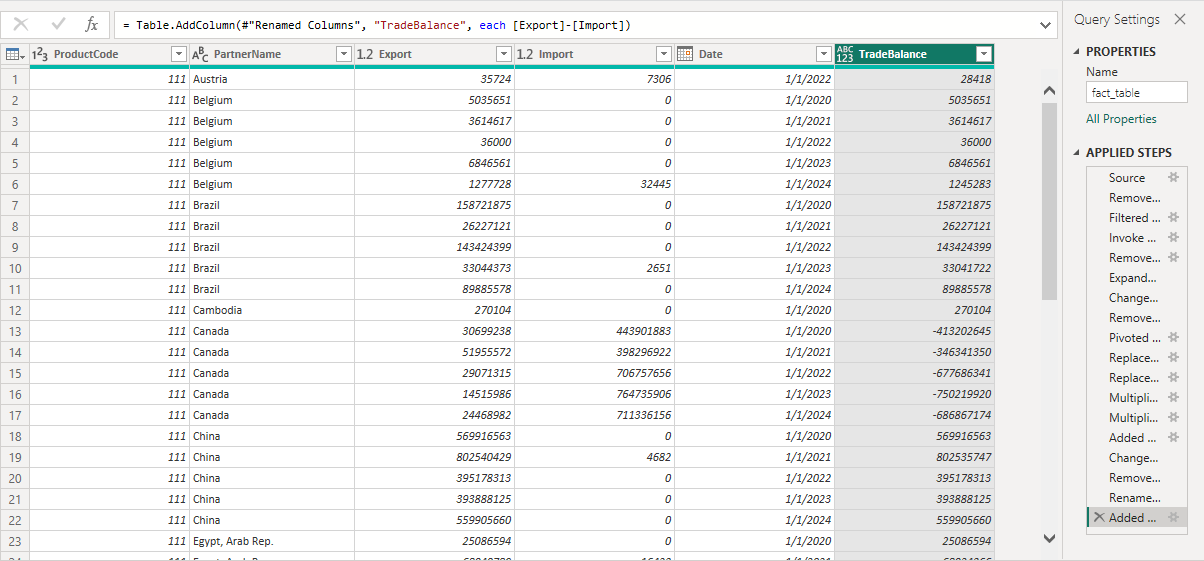
I have a product code which is a foreign key for a product dimension. I have PartnerName which is a foreign key for a geographical dimension. I have an import column and an export column containing import and export values for a specific product to/from a specific country on a specific date. I have a TradeBalance column.
Here is the M-query you would need to get your data in this format:
let
    Source = Folder.Files(FolderLocation),
    #"Removed Columns" = Table.RemoveColumns(Source,{"Extension", "Date accessed", "Date modified", "Date created", "Attributes", "Folder Path", "Name"}),
    #"Filtered Hidden Files1" = Table.SelectRows(#"Removed Columns", each [Attributes]?[Hidden]? <> true),
    #"Invoke Custom Function1" = Table.AddColumn(#"Filtered Hidden Files1", "Transform File", each #"Transform File"([Content])),
    #"Removed Other Columns1" = Table.SelectColumns(#"Invoke Custom Function1", {"Transform File"}),
    #"Expanded Table Column1" = Table.ExpandTableColumn(#"Removed Other Columns1", "Transform File", Table.ColumnNames(#"Transform File"(#"Sample File"))),
    #"Changed Type" = Table.TransformColumnTypes(#"Expanded Table Column1",{{"Nomenclature", type text}, {"ReporterISO3", type text}, {"ProductCode", Int64.Type}, {"ReporterName", type text}, {"PartnerISO3", type text}, {"PartnerName", type text}, {"Year", Int64.Type}, {"TradeFlowName", type text}, {"TradeFlowCode", Int64.Type}, {"TradeValue in 1000 USD", type number}}),
    #"Removed Columns1" = Table.RemoveColumns(#"Changed Type",{"Nomenclature", "ReporterISO3", "ReporterName", "PartnerISO3", "TradeFlowCode"}),
    #"Pivoted Column" = Table.Pivot(#"Removed Columns1", List.Distinct(#"Removed Columns1"[TradeFlowName]), "TradeFlowName", "TradeValue in 1000 USD", List.Sum),
    #"Replaced Value" = Table.ReplaceValue(#"Pivoted Column",null,0,Replacer.ReplaceValue,{"Export"}),
    #"Replaced Value1" = Table.ReplaceValue(#"Replaced Value",null,0,Replacer.ReplaceValue,{"Import"}),
    #"Multiplied Column" = Table.TransformColumns(#"Replaced Value1", {{"Export", each _ * 1000, type number}}),
    #"Multiplied Column1" = Table.TransformColumns(#"Multiplied Column", {{"Import", each _ * 1000, type number}}),
    #"Added Custom" = Table.AddColumn(#"Multiplied Column1", "Custom", each Date.FromText("1/1/" & Text.From([Year]))),
    #"Changed Type1" = Table.TransformColumnTypes(#"Added Custom",{{"Custom", type date}}),
    #"Removed Columns2" = Table.RemoveColumns(#"Changed Type1",{"Year"}),
    #"Renamed Columns" = Table.RenameColumns(#"Removed Columns2",{{"Custom", "Date"}}),
    #"Added Custom1" = Table.AddColumn(#"Renamed Columns", "TradeBalance", each [Export]-[Import])
in
    #"Added Custom1"
You can just copy this M Query into your advanced editor, ensuring you either have FolderLocation as a parameter or by copying the string of the folder where your files are located. LLMs are very helpful for troubleshooting M Query, if you get stuck.
dimGeo ETL with PowerQuery
If you have a query connecting to your dimGeo table, there are only a few more steps to get the geo data transformed:
Promote headers.
Filter out rows with no value in the continent column.
Replace blank trading block with “ROW”
Here is the M-Query for dimGEO ETL
let
    Source = Csv.Document(File.Contents(filelocation),[Delimiter=",", Columns=4, Encoding=1252, QuoteStyle=QuoteStyle.None]),
    #"Changed Type" = Table.TransformColumnTypes(Source,{{"Column1", type text}, {"Column2", type text}, {"Column3", type text}, {"Column4", type text}}),
    #"Promoted Headers" = Table.PromoteHeaders(#"Changed Type", [PromoteAllScalars=true]),
    #"Changed Type1" = Table.TransformColumnTypes(#"Promoted Headers",{{"country", type text}, {"continent", type text}, {"sub_region", type text}, {"Trading Block", type text}}),
    #"Filtered Rows" = Table.SelectRows(#"Changed Type1", each ([continent] <> "")),
    #"Replaced Value" = Table.ReplaceValue(#"Filtered Rows","","ROW",Replacer.ReplaceValue,{"Trading Block"})
in
    #"Replaced Value"
This is an easy one, you can copy the M Query if needed.
dimSIC ETL with PowerQuery
Our fact table comes not with the names of products but with their SIC number. So we need to bring in the product names in a dimensional table. This table is a little bit trickier. When we get this in, there are normal steps to take, like promoting headers and removing the blank column (Column5). But there are some not-normal things about this dataset. For one, its flat and we need it to be hierarchical.
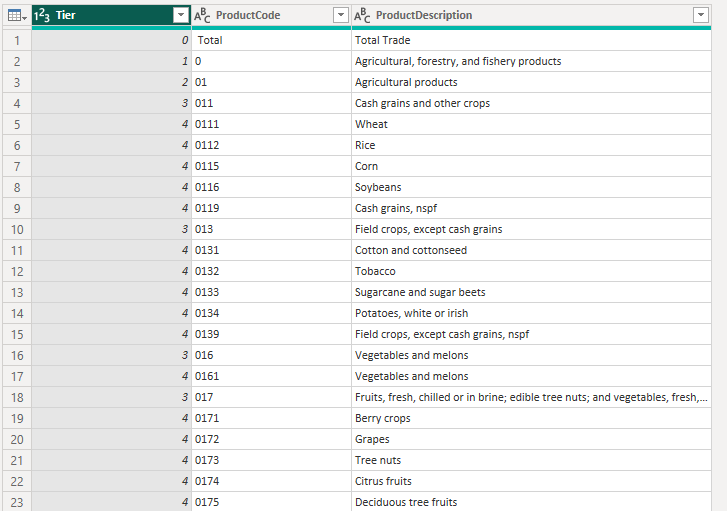
But as you can see, it has a column “Tier” which tells you what level of the hierarchy you’re on. Also SIC code numbers are hierarchical, so the fourth level is citrus fruits which has a number “0174”, the third level is “017” which corresponds to “Fruits…” and “01” is the second level which corresponds to “Agricultural Products” while “0” is the first level which corresponds to “Agricultural, Forestry and Fishery.”
What I’m going to do is:
Filter for tiers 3 and 4 (our fact table doesn’t go all the way down to 4 for all of the trade).
Create a copy of this query
Pull the first 1, 2, 3 digits from the product code
Join of each of these
Rename the columns

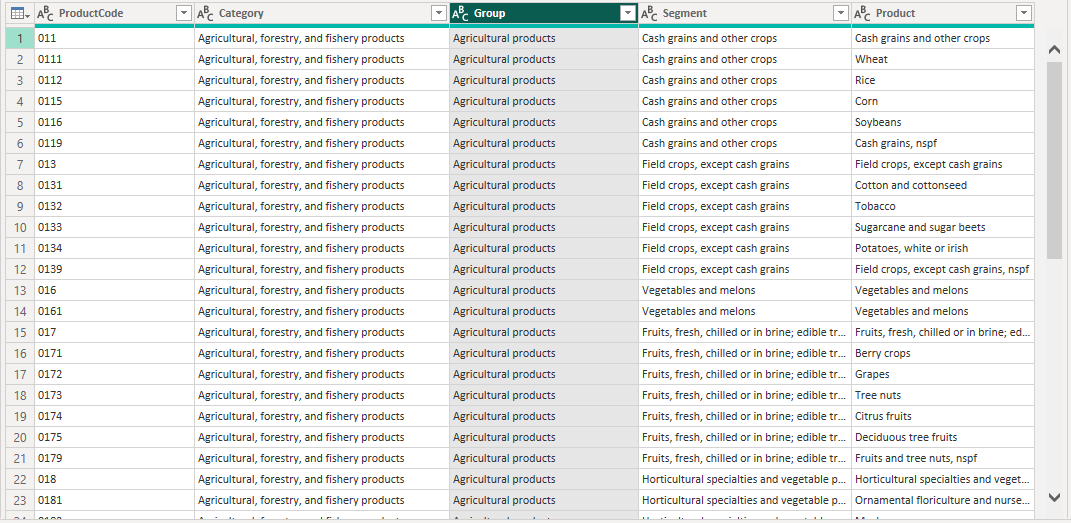
This is what the final dimSIC table looks like. Here is the M Code:
let
    Source = Excel.Workbook(File.Contents(FileLocation), null, true),
    Sheet1_Sheet = Source{[Item="Sheet1",Kind="Sheet"]}[Data],
    #"Promoted Headers" = Table.PromoteHeaders(Sheet1_Sheet, [PromoteAllScalars=true]),
    #"Changed Type" = Table.TransformColumnTypes(#"Promoted Headers",{{"NomenclatureCode", type text}, {"Tier", Int64.Type}, {"ProductCode", type text}, {"ProductDescription", type text}, {"Column5", type any}}),
    #"Removed Columns" = Table.RemoveColumns(#"Changed Type",{"NomenclatureCode", "Column5"}),
    #"Filtered Rows" = Table.SelectRows(#"Removed Columns", each ([Tier] = 3 or [Tier] = 4)),
    #"Added Custom" = Table.AddColumn(#"Filtered Rows", "3digit", each Text.Start([ProductCode], 3)),
    #"Added Custom1" = Table.AddColumn(#"Added Custom", "2digit", each Text.Start([ProductCode], 2)),
    #"Added Custom2" = Table.AddColumn(#"Added Custom1", "1digit", each Text.Start([ProductCode], 1)),
    #"Merged Queries" = Table.NestedJoin(#"Added Custom2", {"3digit"}, #"DNU-SIC", {"ProductCode"}, "dim", JoinKind.LeftOuter),
    #"Expanded dim" = Table.ExpandTableColumn(#"Merged Queries", "dim", {"ProductDescription"}, {"dim.ProductDescription"}),
    #"Renamed Columns" = Table.RenameColumns(#"Expanded dim",{{"ProductDescription", "Product"}, {"dim.ProductDescription", "Segment"}}),
    #"Removed Columns1" = Table.RemoveColumns(#"Renamed Columns",{"Tier", "3digit"}),
    #"Reordered Columns" = Table.ReorderColumns(#"Removed Columns1",{"Product", "Segment", "2digit", "1digit"}),
    #"Merged Queries1" = Table.NestedJoin(#"Reordered Columns", {"2digit"}, #"DNU-SIC", {"ProductCode"}, "dim", JoinKind.LeftOuter),
    #"Expanded dim1" = Table.ExpandTableColumn(#"Merged Queries1", "dim", {"ProductDescription"}, {"dim.ProductDescription"}),
    #"Renamed Columns1" = Table.RenameColumns(#"Expanded dim1",{{"dim.ProductDescription", "Family"}}),
    #"Reordered Columns1" = Table.ReorderColumns(#"Renamed Columns1",{"Product", "Segment", "Family", "2digit", "1digit"}),
    #"Removed Columns2" = Table.RemoveColumns(#"Reordered Columns1",{"2digit"}),
    #"Merged Queries2" = Table.NestedJoin(#"Removed Columns2", {"1digit"}, #"DNU-SIC", {"ProductCode"}, "dim", JoinKind.LeftOuter),
    #"Expanded dim2" = Table.ExpandTableColumn(#"Merged Queries2", "dim", {"ProductDescription"}, {"dim.ProductDescription"}),
    #"Removed Columns3" = Table.RemoveColumns(#"Expanded dim2",{"1digit"}),
    #"Renamed Columns2" = Table.RenameColumns(#"Removed Columns3",{{"Family", "Group"}, {"dim.ProductDescription", "Family"}}),
    #"Reordered Columns2" = Table.ReorderColumns(#"Renamed Columns2",{"ProductCode", "Family", "Group", "Segment", "Product"}),
    #"Renamed Columns3" = Table.RenameColumns(#"Reordered Columns2",{{"Family", "Category"}})
in
    #"Renamed Columns3"
I now have a dimensional table with Product, Segment, Group, Category are four levels of my product hierarchy.
Date Table
Create a date table, here’s the code for that:
date_table =
ADDCOLUMNS(
    CALENDAR(MIN(fact_table[Date]), MAX(fact_table[Date])),
    "Year", YEAR([Date]),
    "MonthNum", MONTH([Date]),
    "Month", FORMAT([Date],"mmm"),
    "Month-Year", FORMAT([Date], "mmm yyyy"),
    "Sort Key", YEAR([Date])*100 + MONTH([Date])
I wrote in more detail about date tables here.
Building Out the Data Model
I now have a fact table and dimension tables for date, geography and product hierarchy. Each of the dimension tables can be easily connected to the fact table with a one-to-many relationship. Here’s what that looks like in practice.
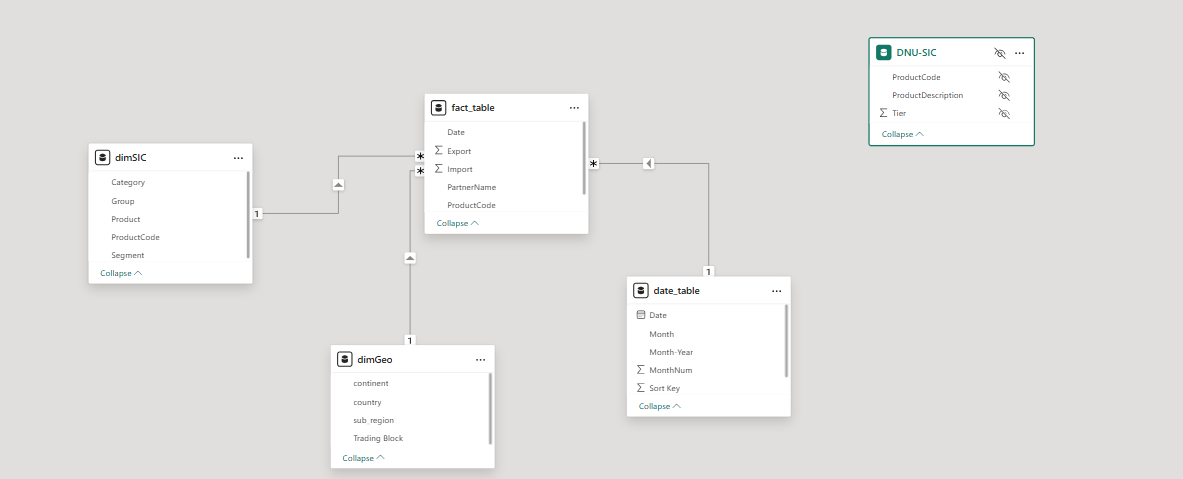
DNU-SIC is a copy of the raw dimSIC query which I used to join the names of all of the family, segment and group names onto the 1, 2, and 3 digit IDs. I clicked on the three dots and clicked “hide in report view” because I don’t want directly use the data in this table.
Conclusion
This was a big post. Power Query and data modeling are 75% of the work for creating reports. Getting this part right makes the rest of your development either very easy, getting it wrong makes it very difficult.
The takeaways from this are:
Power query to Tidy data (or data that is one step away from Tidy)
Star Schema (or snowflake)
Next time I’ll go through my workflow for accelerating report aesthetic development with AI. This workflow gets you a beautiful and aesthetic report in roughly a half hour. I’ll also go through spot-checking some of our dimensional tables for accuracy (we will have to make minor changes to some country names).
-BTA