
DAX Deep Dive: The Calculate() Function

Apologies for the hiatus, I got sucked into learning about AWS for about three months and had an addition to my family. Today I'm starting a series going deeper on DAX. You read can my beginner post here, which was part of my overall beginner Power BI series. I'm going to be explaining the DAX functions that I use the most and that will help you to minimize DAX use and create quick and responsive visuals. Today’s subject is the CALCULATE() function.

DAX Filter Functions Overview
Filter functions return a subset of data based off of certain conditions and may or may not perform some action on that data. For a full list of filter functions, you can check out the documentation here. The filter functions that I use most are:
CALCULATE()
LOOKUPVALUE()
ALLEXCEPT()
Today I’m going to show you how to use the calculate function, CALCULATE().
How to Use CALCULATE()
The Calculate() function performs some aggregation function in a modified context. It contains two parts, the function part and the filter part.
CALCULATE(Function, Filter)Calculate is most useful when creating you want to display specific metrics that you want to freeze across only one dimension. In my post on visuals, I talked about my favored report design, 1-2 big visuals with metrics that reinforce the story that the visuals are telling above.
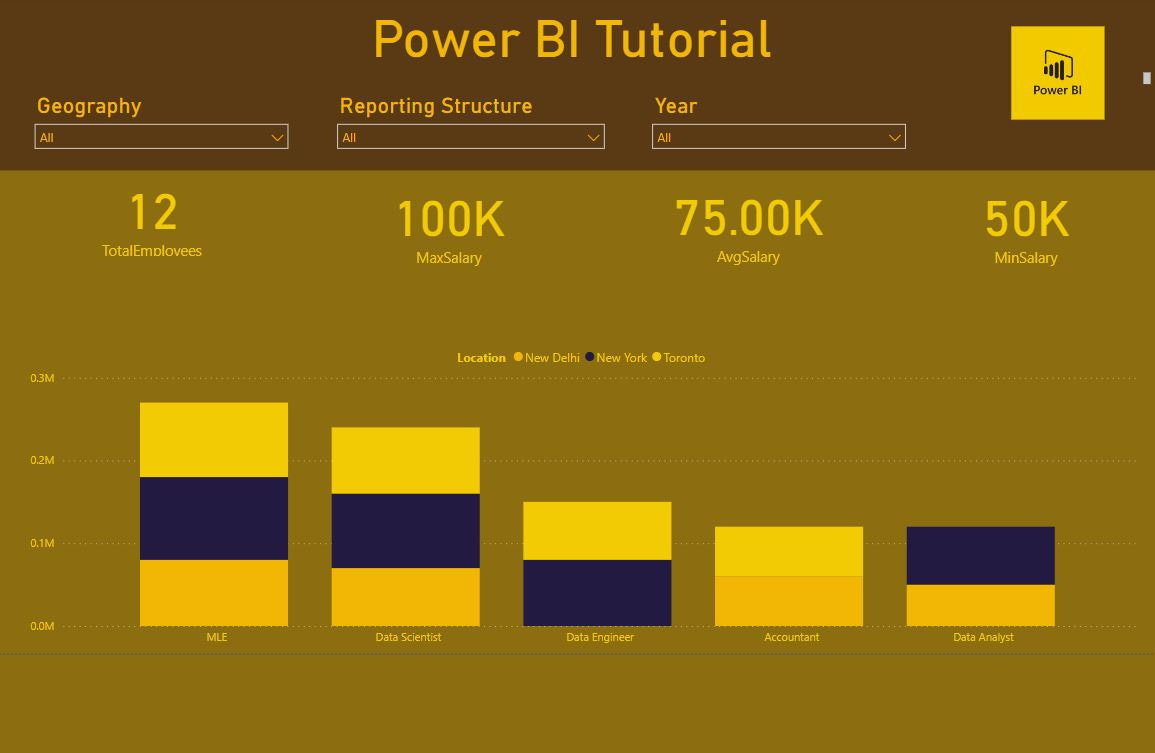
Calculate() is perfectly suited for the metrics displayed in this example. Let’s say, you have sales data that has a product dimension and a geographical dimension. Assuming you’ve done your data modeling correctly AND your data is tidy, you might want to display some metric by one specific dimension while maintaining the flexibility to filter by others. Calculate() allows you to do this.
CALCULATE() Example
This is abstract, so I’m going to give you a concrete example.
NYAvgSal =
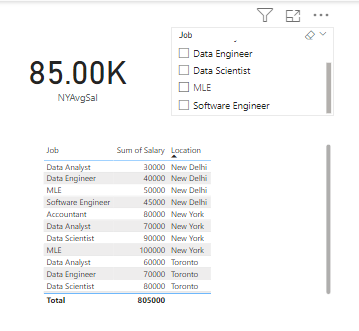
CALCULATE(AVERAGE(Employment[Salary]),Employment[Location] = "New York")This is a measure to determine the average salary for all employees located in New York. The function is AVERAGE(Employment[Salary]). AVERAGE is the calculation being performed, Employment is the table and Salary is the column. The filter is Employment[Location] = “New York”. This measure will display the average salary of all New York workers selected with the filters.
As a metric displayed in a card at the top of your report, this will change based on other dimensional filters, like department or job type. If you filter out ALL “New York” data with filters, this value will be blank.
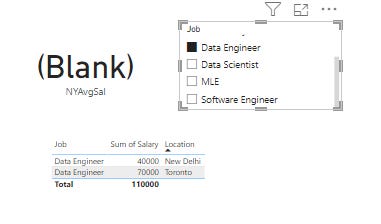
This isn’t good. This doesn’t look good in your reports. If an end user sees “Blank,” you (and your boss) will probably hear about it.
CALCULATE() EXAMPLE PART 2
So what do we do to mitigate this error? We can either create another measure with IF() and ISBLANK() statements OR we can use a variable in our original measure and incorporate IF() and ISBLANK() statements into our original measure. I’m going to do the latter, while maintaining lines to “break up” the DAX.
NYAvgSal =
VAR AVGSAL = CALCULATE(
    AVERAGE(Employment[Salary]),
     Employment[Location] = "New York"
     )
RETURN IF(ISBLANK(AVGSAL),0,AVGSAL)
Our final measure ends up looking like this. Lets break it down:
VAR - creates a variable AVGSAL, which is the our original DAX functions that calculates the average salary based on the location of “New York”
RETURN - Is the return statement of the measure. (I’ll do a post on VAR/RETURN statements later)
IF - returns 0 if the AVGSAL variable is blank, else it returns AVGSAL
ISBLANK - checks if AVGSAL is blank
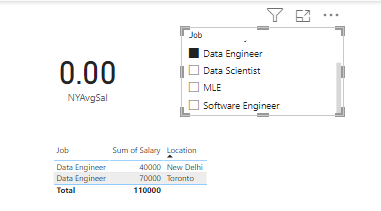
Now we have a measure that displays the average salary of people who work in New York…
AND it displays zero if all “New York” salaries are filtered out instead of BLANK.
Conclusion
That’s the DAX CALCULATE() function. It’s very useful for creating the sorts of metrics I like to place on my page to reinforce the points I am communicating with my main visuals.