
DAX Deep Dive 3: The SWITCH() Function

Welcome to part 3 of my Deep Dive into DAX. This post is about the SWITCH() function which acts as control flow embedded in your DAX function. If you’re new to DAX or Power BI, I recommend you check out my beginner series here.
The SWITCH function in DAX (Data Analysis Expressions) is a powerful tool used for conditional branching in Power BI. It's similar to a series of nested IF statements BUT its more readable and efficient. Here’s how SWITCH() works:
A switch series work by evaluating an expression against a list of potential values.
When a value is matched, the switch expression returns a result associated with that value (compare to if and elif statements in python).
If no value is matched, another result can (but does not have to be) returned (compare to else statement).
SWITCH Function Syntax
Here’s the syntax for a DAX expression using the switch statement.
SwitchMeasure =
SWITCH(
Expression,
Value1, Result1,
Value2, Result2,
Value3, Result3,
Result4
)
In the syntax example, expression is typically a table/row combination. Each result is what is returned if the specific value is equal to the table/row combination. If none of the Values matches, result4 is returned. The SWITCH() function works as a giants if, elif, elif, else statement.
SWITCH() Function Example
Here's an example:
SWITCH(
    Product[Category],
    "Fruits", "Healthy",
    "Vegetables", "Healthy",
    "Candy", "Unhealthy",
    "Unknown"
)
In this example, we have a table titled, product with a column category. If the product category is Fruits, this SWITCH function will return healthy. If the product category is Vegetables, the SWITCH() function will return healthy. If its candy it will return Unhealthy. If its none of these it will return unknown.
More In-Depth SWITCH() Function Example
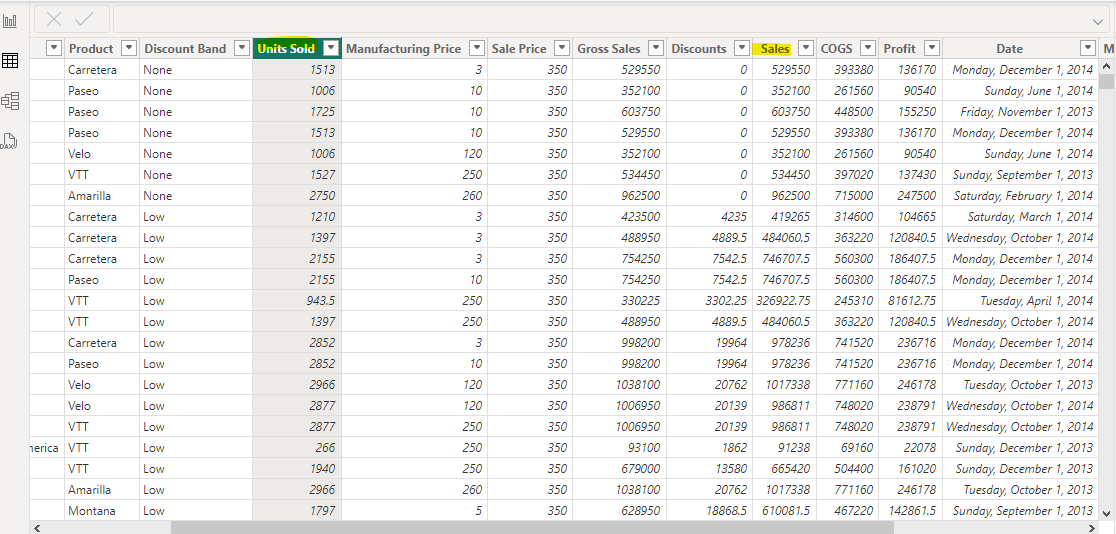
Switch works well in DAX functions when combined with Variables to change displayed metrics and visuals in the page of a report. For this example, I’m working in the competitive marketing analysis .PBIX file.
To create a truly immersive report, I want to be able to switch back and forth between different metrics in the dataset. This dataset isn’t tidy, but has multiple metrics for each scenario. One option to deal with this is to pivot the data to make it “taller” and then use the metric column as a slicer. Another option is to use DAX, specifically SWITCH() to switch back and forth between metrics.
For this example I’ll be switching back and forth between Units and Sales.
Prep Work.
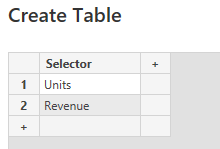
There’s a little prep work that needs to be done first. We need to create a new table that is a single column and consists of each of the different “metrics” we want to select for. Here’s how we do this:
At the top of the page, click enter data.
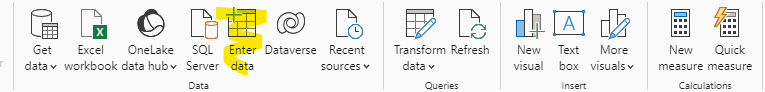
You’re creating a table here to be used as a slicer. The values in this table are what the “expression” portion. For this example, the values will be “units” and “revenue.
Now that we have out expression built, its time to create the DAX function that will power our visual.


SWITCH() Function
Remember that the switch function works by taking in an expression and then spitting out different results depending on what the value of that expression is. Here’s how we create a slicer out of two distinct columns.
SwitchMeasure =
VAR MySelection = SELECTEDVALUE(Selector[Selector])
VAR ReturnValue = SWITCH(
    TRUE(),
    MySelection = "Units", SUM(financials[Units Sold]),
    MySelection = "Revenue", SUM(financials[ Sales])
    )
RETURN ReturnValue
This measure has two variables MySelection and ReturnValue.
MySelection is whatever value is selected from the Selector column of the Selector table. This table/column combination is what was created in step 2 of the “prep work” section.
ReturnValue uses the switch function to return the sum of financial sales (if MySelection = “revenue”) or the sum of units sold (if MySelection = “Units”).
Return value is then returned.
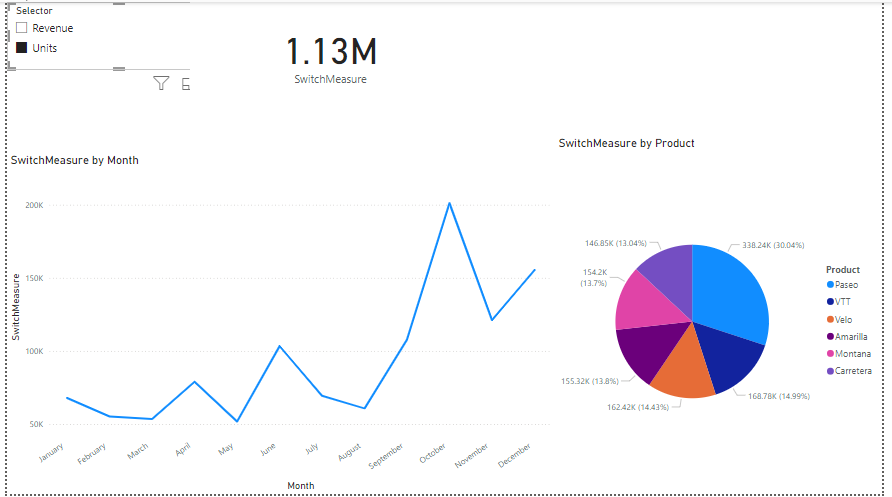
The end result of this is a measure that displays sales revenue and related visuals when “Revenue” is selected with the slicer…
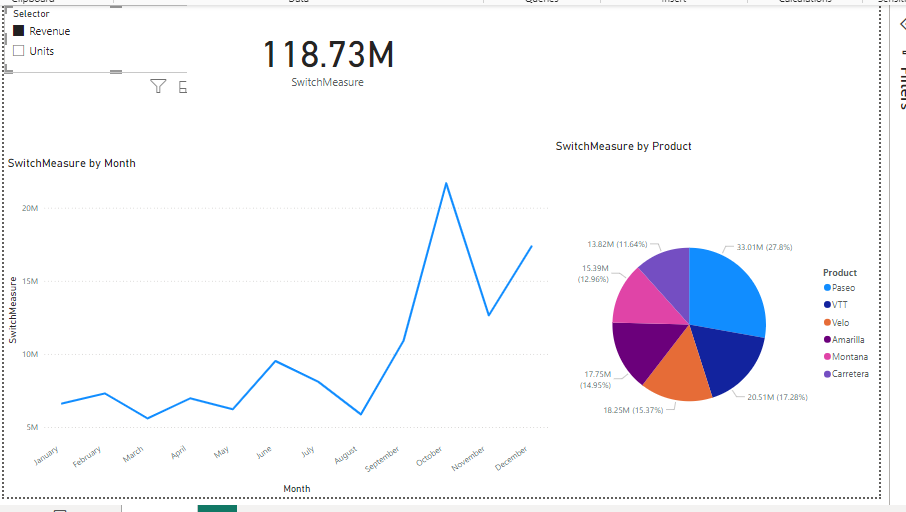
And Sales Units with related visuals when “Revenue” is selected with the slicer.
Conclusion
The SWITCH function and the more complex use case are the sorts of skills that can give you the leverage to jump from an entry level data analyst to Mid-level or Senior. SWITCH() can also be combined with the CALCCULATE() function to add filtering to to the final calculations and provide a variety of metrics to place above your main visuals.